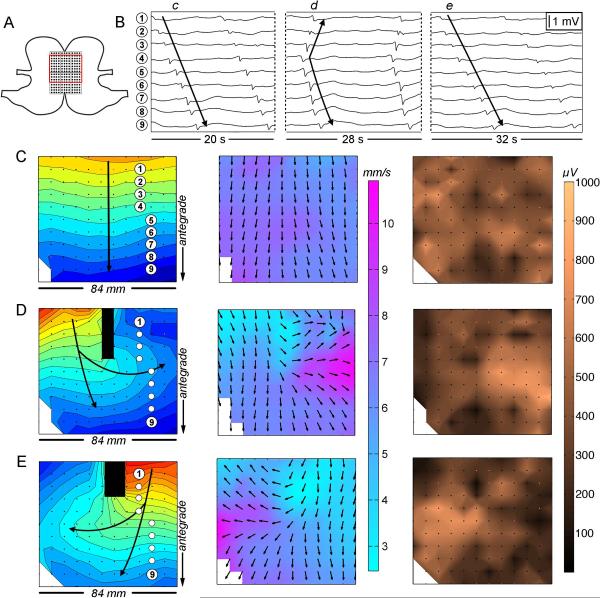
Figure 5.
Velocity and amplitude profiles during incomplete conduction block. (A) Position diagram showing the array on the greater curvature (7.6 mm electrode spacing, 96 cm2). (B) Electrogram sequences; c–e correspond to activities and electrode positions in C–E. (C) Normal cycle with an antegrade propagating wavefront (mean velocity 6.4 ± 0.9 SD mm s−1; mean amplitude 440 (SD 170) μV). 1 s isochrones are used. (D,E) Cycles showing incomplete conduction block with circumferential conduction directed either posteriorly (D) or anteriorly (E) beneath the block. A region of high velocity and high amplitude activity is associated with the circumferential conduction (8.9 ± 1.2 SD mm s−1 for the area of interest, p<0.001 vs normal cycles; 640 ± 135 SD μV, p<0.001). Rapid circumferential conduction gives rise to elliptical wavefronts. Waves propagating antegrade and retrograde from the point of circumferential conduction again develop slower, low amplitude propagation profiles.

