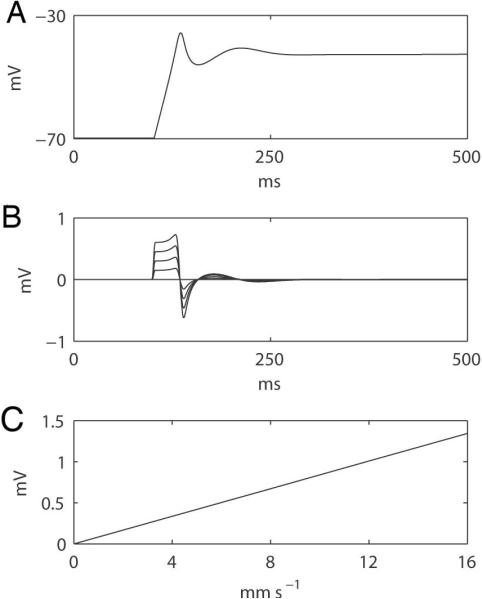
Figure 7.

Simulated relationship between extracellular potentials and propagation velocity based on the derived mathematical formula (Eqn. 1; Appendix C). (A) A simulated membrane potential of a gastric slow wave model was applied (20). (B) Simulated extracellular potentials at different propagation velocities (0 to 16 in 4 mm s−1 increments); the larger velocities correspond to the higher amplitude traces. (C) Correlation between the amplitudes of the simulated extracellular potentials and propagation velocities, showing a slope of 84 μV per 1 mm s−1 of velocity increase.
