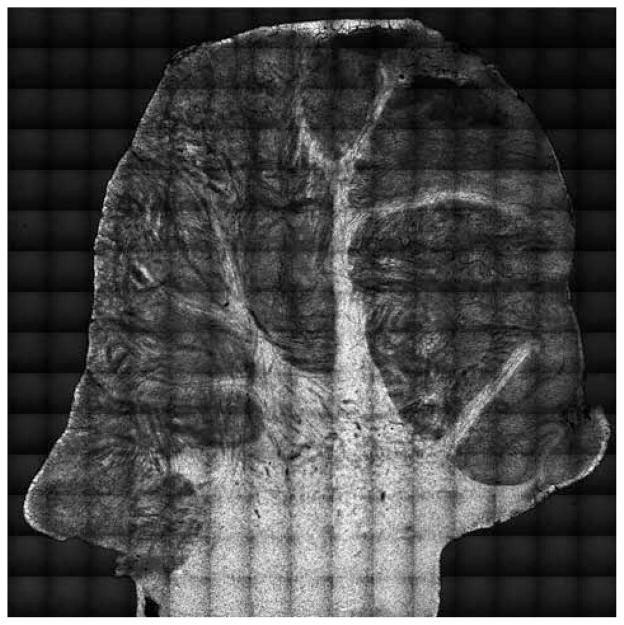
Figure 1.
Mosaic of CARS images of cerebellum tissue section of a domestic pig. Raman shift was set at the 2850 cm−1 CH2 symmetric stretching vibration to visualize lipids. Bright signals correspond to white matter (lipid-rich, myelined axons) and dimmer signals correspond to grey matter (lipid poor areas). Total area is 1.4 × 1.4 cm2. Reprinted in part with permission from Ref. [36].

