Figure 5.

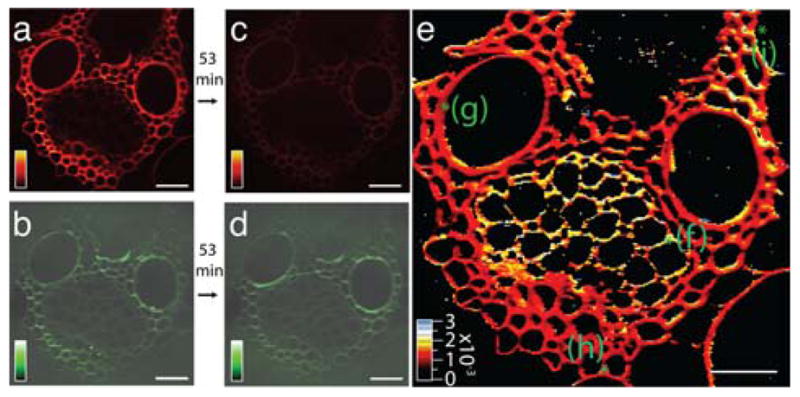
(online color at: www.biophotonics-journal.org) Real-time SRS imaging of a delignification reaction in corn stover. (a) Lignin signal at 1600 cm−1 before the start of the reaction. (b) The cellulose signal at 1100 cm−1 before the start of the reaction. (c) Lignin signal after a 53 min time course of a treatment with acid chlorite, showing significant reduction (more than eightfold) compared to (a). (d) Cellulose signal after treatment, which remains roughly the same as in (b). (e) False-color heat map of the reaction rate constant obtained by fitting the time series of the lignin decay in the reaction to a single exponential. The initial and final points are shown in images (a) and (c). The rate-constant [s−1] color scale is shown in the bottom left corner. Scale bar is 40 μm. Reprinted in part with permission from Ref. [60].
