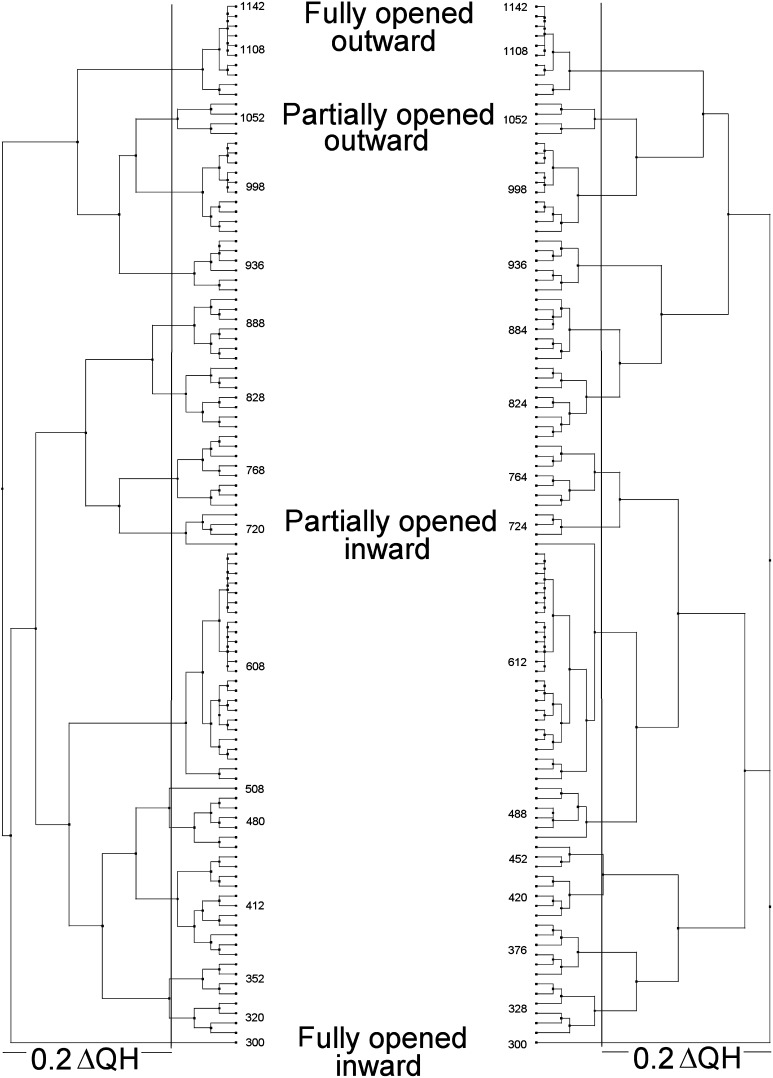
Figure 1.
Phylogenetic tree representations for human Pgp structures derived from target molecular dynamics trajectories. QR factorizations on the N-terminal half (left) and C-terminal half (right) of the human P-glycoprotein targeted molecular dynamics trajectory were performed as described in Experimental Procedures. A ΔQH cutoff of 0.2 (solid vertical lines) resulted in the selection of 16 representative structures in each half of the protein. Selected representative trajectory structure numbers are shown on the inside of each tree. The locations of the four targets (fully opened inward, partially opened inward, partially opened outward, and fully opened outward) are also indicated with text. The trajectory frame numbering was sequential from fully opened inward to fully opened outward conformations. Model numbers are arbitrary other than indicating the sequential order of the structure snapshots.

