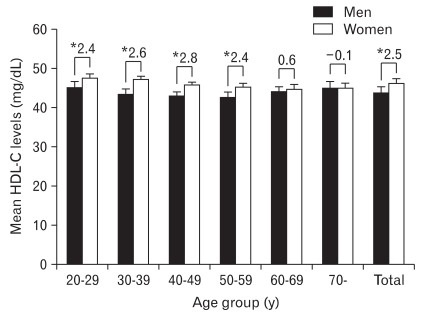
Figure 2.
Covariates-adjusted age group specific gender difference in level of high density lipoprotein cholesterol (HDL-C) (mean ± SD). *Significantly different between men and women at P < 0.001 by general linear models. Data were adjusted for education level (-6 y, 7-12 y, 13 y-), current smoking status (yes or no), the amount of alcohol intake (men: no, ≤30 g/day, >30 g/day; women: no, ≤15 g/day, >15 g/day), body mass index (-22.9 kg/m2, 23-24.9 kg/m2, 25 kg/m2-), fat intake (% of total energy intake; <10%, <20%, ≥20%), low density lipoprotein cholesterol (<130 mg/dL, ≥130 mg/dL), triglyceride (<150 mg/dL, ≥150 mg/dL). Age (y; continuous) was further adjusted for total group.

