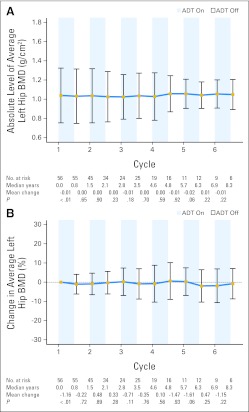
Fig 4.
Average and 95% CIs of (A) absolute and (B) percentage change in standardized average bone mineral density (BMD) relative to baseline at the left hip are represented in the line graph over multiple cycles of intermittent androgen deprivation. Displayed below each graph are the number of patients at risk, median years from initiation of androgen deprivation therapy (ADT), mean change in left-hip BMD relative to last dual-energy x-ray absorptiometry scan, and P values from one-sided t tests.

