Figure 1. .
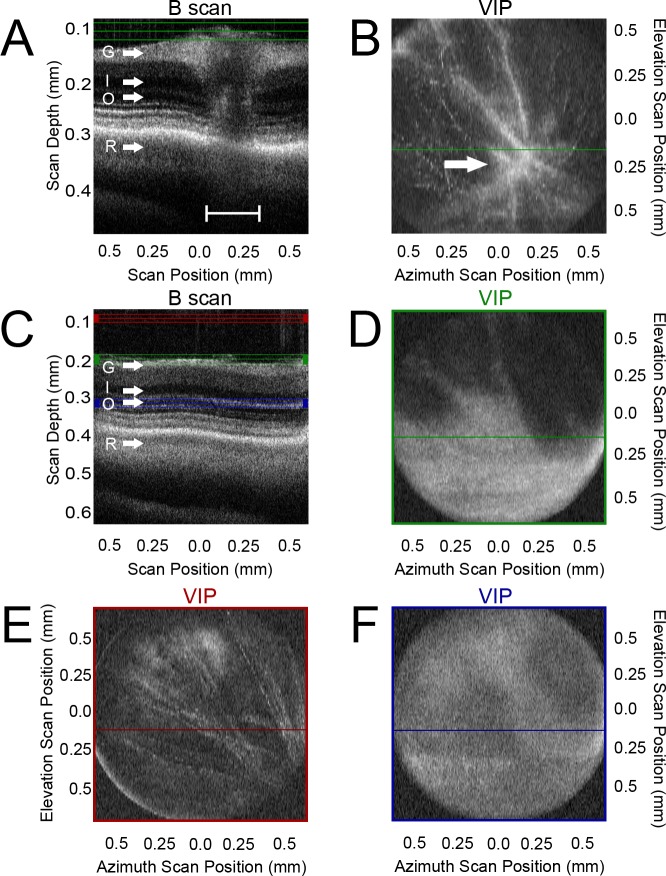
Volume intensity projection orients the scan using the optic stalk as a retinal landmark. (A) A side-by-side tiling of averaged A-scans resulted in a B-scan projection of the central retina containing the optic stalk (bracket). Green lines represent the region analyzed in (B). (B) A volume intensity projection (VIP) clearly showed convergence of arborizations to the optic stalk region (arrow). (C) A B-scan of the dorsal retina near, but not containing, the optic stalk. Red lines represent the region analyzed in (E). Green lines represent the region analyzed in (D). Purple lines represent the region analyzed in (F). (D) VIP of the region containing the inner retinal surface reveals capillaries concentrating toward the optic stalk just outside the lower right quadrant. (E) VIP of the vitreal region revealed a finer distortion of the capillary arborizations concentrating toward the optic stalk just off the field of view to the bottom right. (F) VIP of the retinal ONL region shows very faint distortions still concentrating toward the optic stalk. G, ganglion cell layer; I, inner nuclear layer; O, outer nuclear layer; R, retinal pigmented epithelium basal limit.

