Figure 2. .
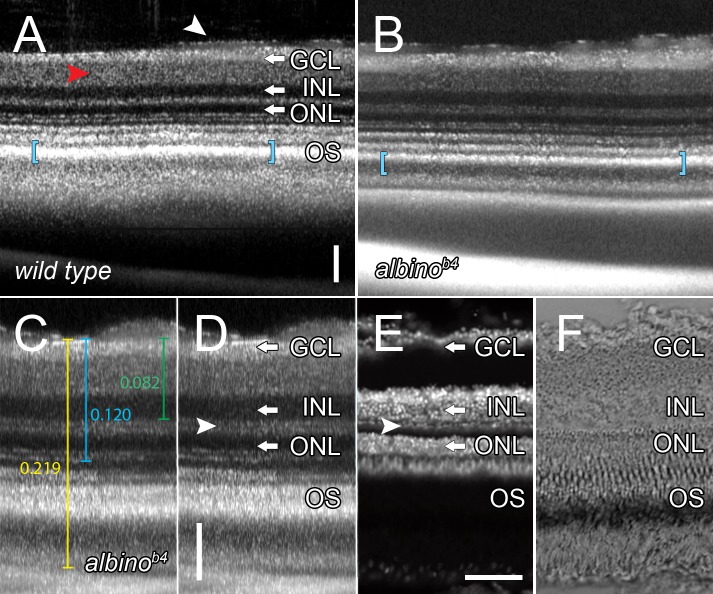
SD-OCT accurately reveals retinal lamination features. (A) B-scan of an adult AB strain zebrafish eye in situ. Highlighted are the IPL (red arrowhead), and a capillary (white arrowhead). (B) B-scan of an adult albinob4 zebrafish eye in situ. Note the difference in signal thickness in the photoreceptor outer segment region (blue brackets, A and B). (C, D) B-scan of an independent albinob4 zebrafish eye displaying optical calipers to measure axial image distances with the retinal layers labeled. The arrowhead points to the horizontal cell nuclei (thin dark band) and the vertical white bar is a scale bar in the axial dimension. (E) TO-PRO-3 labeling of cryosections of the same retina visualized by SD-OCT in (C). Arrowhead points to horizontal cell nuclei. (F) DIC micrograph of the retinal section shown in (E). Note the ability to overlay the SD-OCT B-scan onto the cryosection retinas. Scale bars: 50 μm.

