Figure 5. .
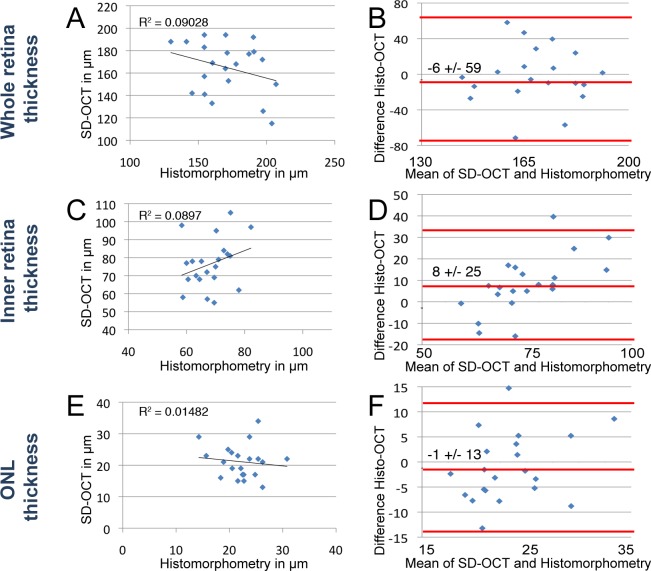
Comparison of morphometry by histology and SD-OCT in light-damaged retinas. Morphometric comparisons of whole retina (A, B), inner retina (C, D), and ONL (E, F) were plotted. Scatterplots of whole retina thickness (A), inner retina (C), and ONL (E) measurements by histomorphometry (x-axis) against SD-OCT (y-axis) of the same fish. Bland–Altman plots depict the agreement between histomorphometry against SD-OCT of the whole retinal thickness (B), inner retina (D), and ONL (F). The middle red line on the Bland–Altman plots represents the mean difference and is bound by the 95% CI (flanking red lines). (A) Best fit line of measurements over the whole retina showed no correlation (R2 = 0.090). (B) The mean difference of histology compared with SD-OCT was −6 ± 59 μm (95% CI) over the average thickness of 174 μm. (C) Best fit line of measurements over the inner retinal thickness showed no correlation (R2 = 0.090). (D) The mean difference of histology compared with SD-OCT was 8 ± 25 μm (95% CI) over the average inner retinal thickness of 69 μm. (E) Best fit line of measurements over the ONL thickness showed no correlation (R2 = 0.015). (F) The mean difference of histology compared with SD-OCT over the average ONL thickness was −1 ± 13 μm (95% CI) over the average ONL thickness of 22 μm.

