Figure 8. .
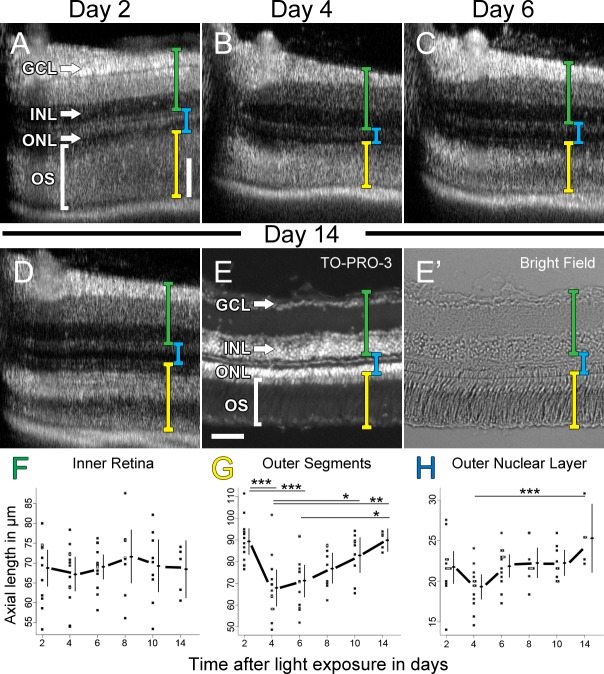
Changes in lamination in light-damaged retinas over 14 days. (A–D) SD-OCT averaged B-scan images of the retina of a single representative fish at day 2 (A), day 4 (B), day 6 (C), and day 14 (D) after 1 day of constant, intense light treatment. Axial lengths of the inner retina (green bracket), outer retina (yellow bracket), and ONL (blue bracket) were quantified. After 14 dpl, this same retina was cryosectioned and the nuclei were stained with TO-PRO-3 and the retina was visualized under epifluorescence (E) and light differential interference (E'). Quantification of axial length measurements of the inner retina (F), outer retina (G), and ONL (H) were plotted throughout the time course. Individual dots represent the axial SD-OCT measurement of a retina 300 μm directly dorsal to the optic stalk (dark area at the left of each panel). Vertical lines to the right of the dots represent the 95% CI and the dot on the line represents the mean. Lines are drawn between the means to highlight potential differences. ANOVA analysis demonstrated no statistical difference of the means of the inner retinal thickness over time (n = 5, P > 0.5). ANOVA analysis revealed a statistical difference (n = 5, P < 0.005) of the means of the outer retinal thickness (G) and ONL thickness (H). The asterisks above the lines represent a statistically significant difference between paired time points (n = 5, ***P < 0.005, **P < 0.01, *P < 0.05) assessed by post hoc Tukey's HSD test. Scale bars: (A–D and E and E') 50 μm.

