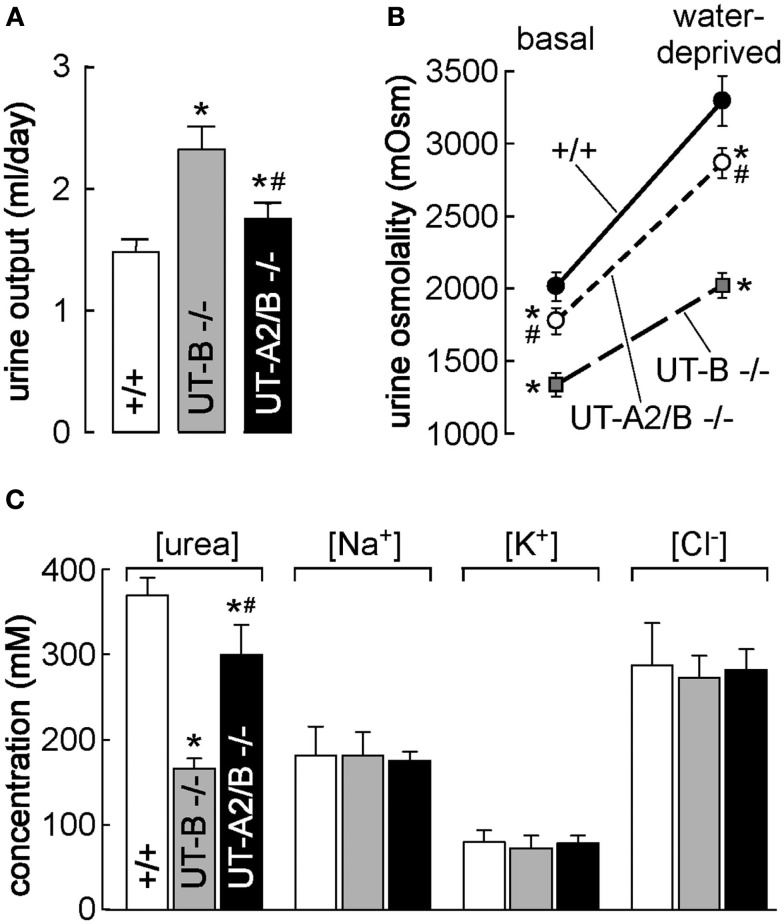
Figure 2.
Urea transporter-B knockout and UT-A2/UT-B knockout mouse models. (A) Twenty-four hours urine output in mice of indicated genotype. (B) Urine osmolality measured in mice given free access to food and water (basal) and after an 18-h water deprivation (right; n = 6 mice/group, means ± SE, *p < 0.01 compared with WT mice. #p < 0.01 compared with UT-B KO mice). (C) Urea concentration, sodium concentration, potassium concentration, and chloride concentration in homogenized IM (means ± SE, n = 6. *p < 0.01 compared with WT mice. #p < 0.01 compared with UT-B KO mice). Reproduced from Lei et al. (2011).

