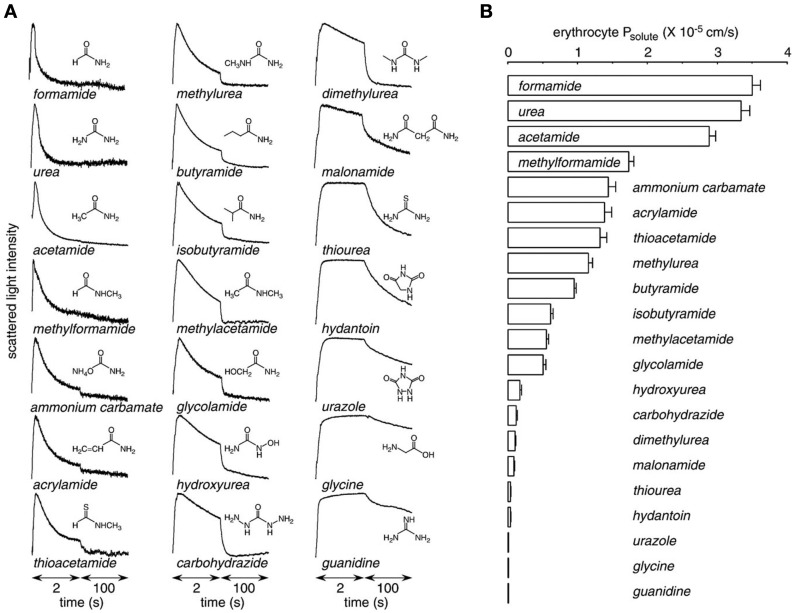
Figure 4.
Urea analog permeability mediated by UT-B. Erythrocyte solute permeability measured by stopped-flow light scattering. (A) Representative curves for the time course of scattered light intensity at 10°C in response to a 250-mM inwardly directed gradient of urea. (B) Averaged solute permeability coefficients (Ps) for experiments done as in panel A (mean ± S.E., n = 3). Reproduced from Zhao et al. (2007).

