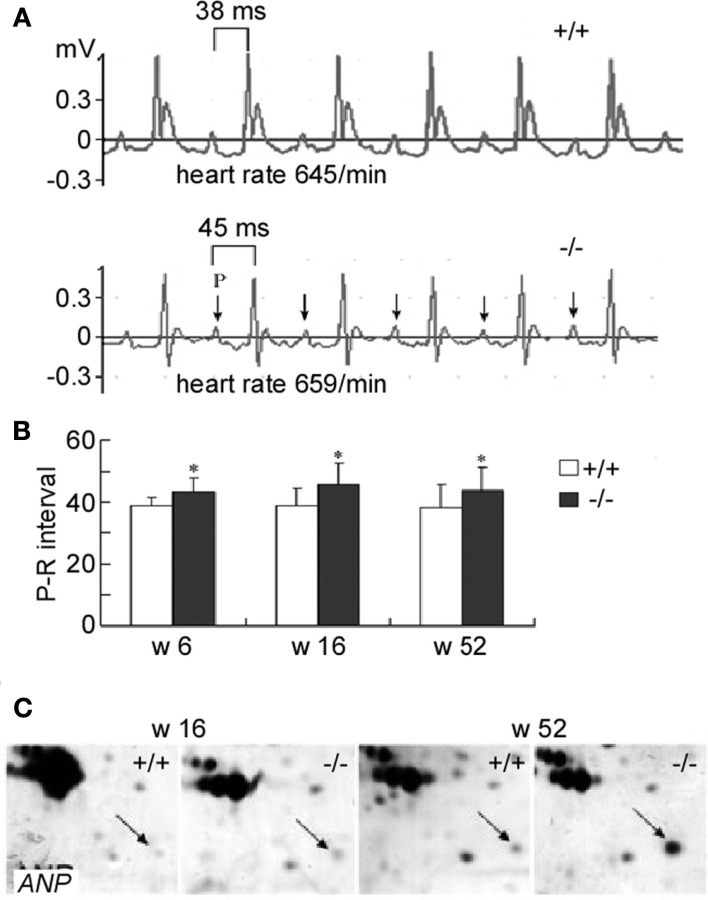
Figure 6.
Surface electrocardiogram and action potential in mice lacking UT-B. (A) The II standard lead ECG of WT and UT-B null mice. (B) The P-R interval in WT and UT-B null mice (mean + SD, n = 20, *p < 0.05 vs. WT mice). (C) The expression level of ANP in 16- and 52-week-old WT and UT-B null mice. Reproduced from Meng et al. (2009), Yu et al. (2009).

