Figure 7.
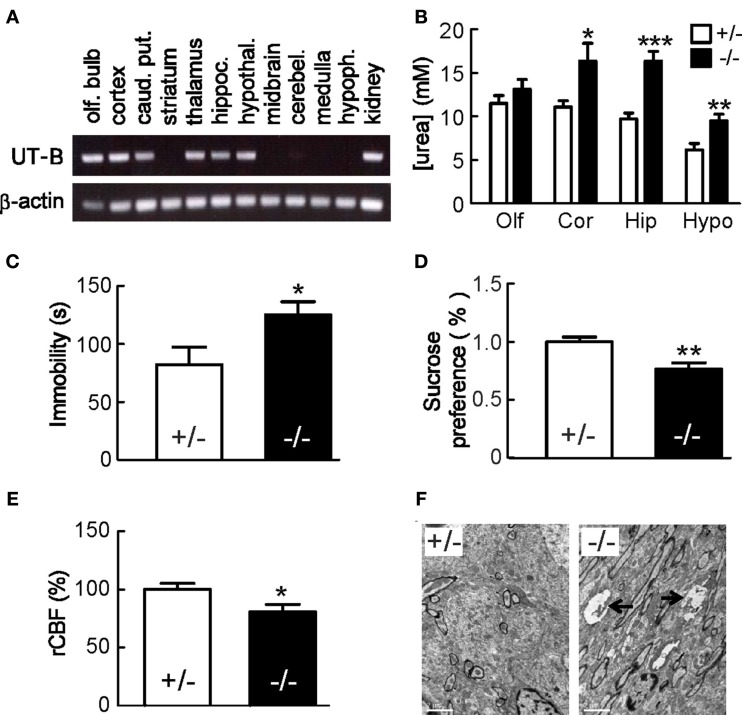
Mice lacking UT-B display depression-like behavior. (A) UT-B mRNA expression in indicated brain regions determined by RT-PCR. α-actin was used as reference control. (B) Urea concentrations in Olf, olfactory bulb; Cor, cortex; Hip, hippocampus; Hypo, hypothalamus. Mean ± SE, *p < 0.05, **p < 0.01, ***p < 0.001, compared with heterozygous mice, n = 10. (C) Forced swim test. Immobility time was recorded for 5 min. (D) Sucrose preference test. Mean ± SE, n = 15. (E) rCBF was assessed by laser Doppler flowmetry. Mean ± SE, n = 10. (F) Representative transmission electron microscopic images of the hippocampus, which show swelling of unmyelinated fibers with myelin figure in UT-B null mice. Reproduced from Li et al. (2012).

