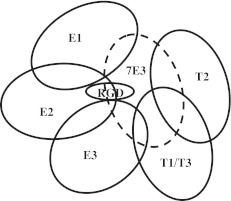
Figure 6.
Schematic representation of likely “footprints” for patient Abs E1, E2, and E3 and T1, T2, and T3 based on inhibition of Ab binding by mAbs specific for subdomains of the αIIb and β3 head regions. The footprint for mAb 7E3 (and abciximab) is shown by the dashed oval. “RGD” indicates approximate location of the binding site for RGD peptide, eptifibatide, and tirofiban.

