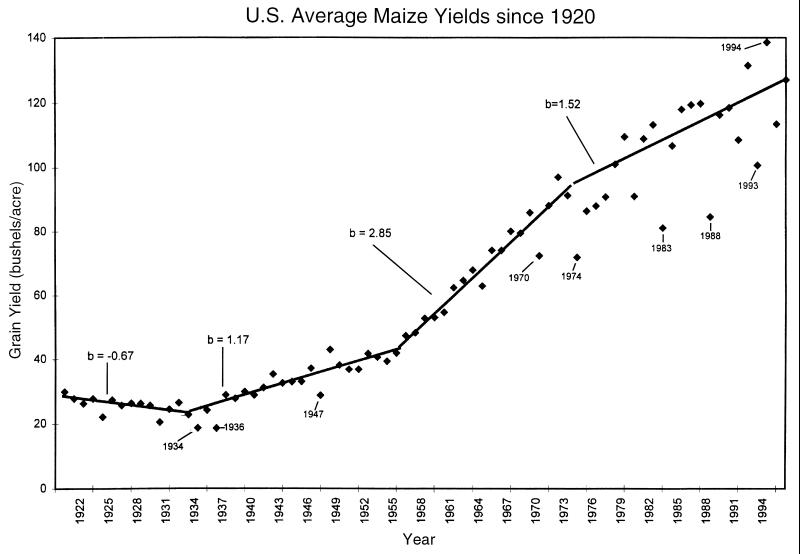
Figure 1.
Regression of U.S. maize grain yields on four groups of production years spanning 1920–1996. Points labeled in the plot were excluded from the analysis without altering the relative differences among the four groups of years. The regression coefficient for each regression line is indicated. (Reproduced with permission from O. S. Smith, United States Department of Agriculture Agricultural Statistics).

