Fig. 6.
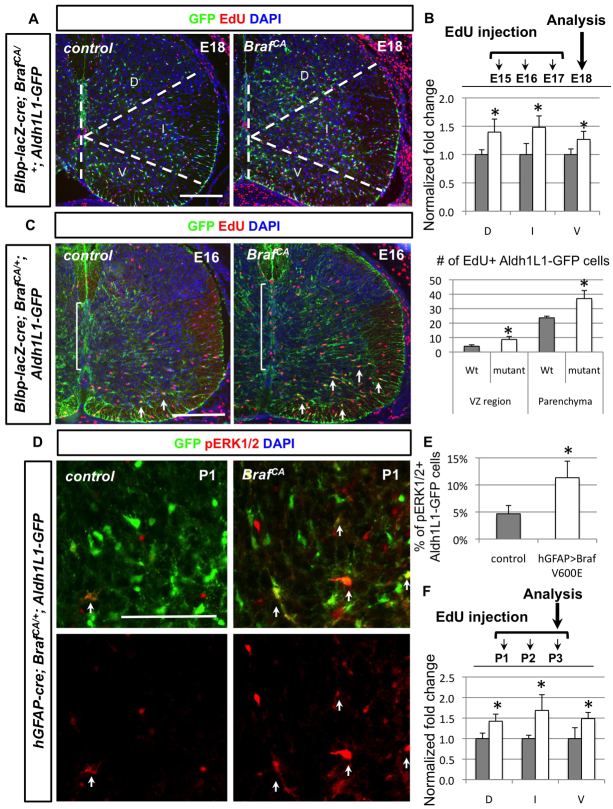
Conditional activation of BRAFV600E in radial glia at different stages results in overproduction of Aldh1L1-GFP+ cells. (A,B) At E18, Blbp-lacZ-cre; BrafCA/+ animals show increased EdU+ (red) Aldh1L1-GFP+ (green) cells in all three domains when EdU is injected from E15 to E17. The percentage of EdU+ Aldh1L1-GFP+ cells among all GFP+ cells in each domains is quantified (n=3 for each genotype). The percentage is then normalised by control and the control is arbitrarily set to 1 in the bar graph (B). Grey bars represent control whereas white bars are for mutant animals. (C) Colocalisation of EdU (red) and Aldh1L1-GFP+ (green) cells is examined in Blbp-lacZ-cre; BrafCA/+ animals with a short pulse of EdU injection 1 hour before perfusion. Both populations of Aldh1L1-GFP+ cells lining in the VZ (indicated by brackets) and in the parenchyma (indicated by arrows) show significantly increased number of EdU incorporations. The quantification of number of EdU+ Aldh1L1-GFP+ cells is shown in the bar graph. (D,E) In hGFAP-cre; BrafCA/+ spinal cord, pERK1/2+ (red) Aldh1L1-GFP+ (green) cells are significantly increased and quantified in E. (F) EdU injection timetable of hGFAP-cre; BrafCA/+ mice is shown and normalised fold change of EdU+ Aldh1L1-GFP+/Aldh1L1-GFP+ compared with littermate controls are quantified in three different domains. Grey bars represent control whereas white bars are for mutant animals. Statistical analyses are performed by t-test. *P<0.05. Error bars represent s.d. Scale bars: 100 μm.

