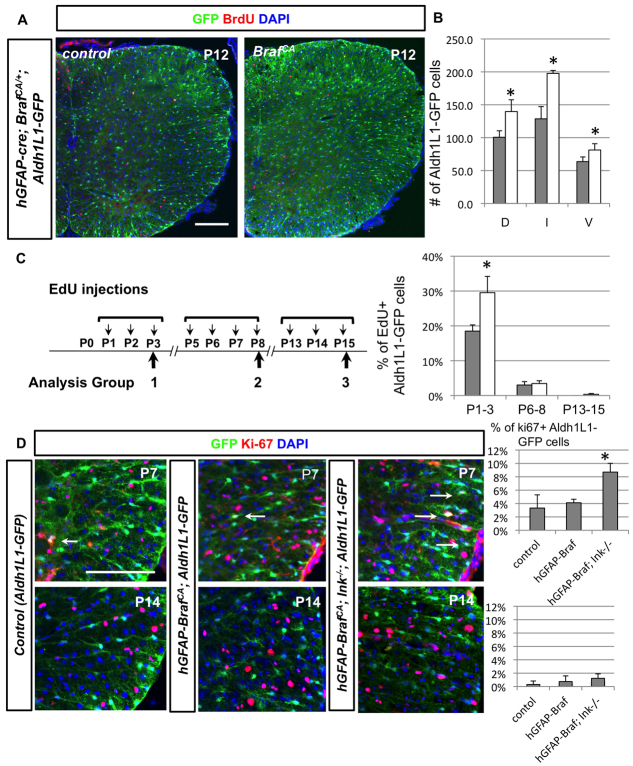
Fig. 7.
Conditional BRAFV600E animals do not exhibit increased proliferation potential in Aldh1L1-GFP+ cells after P5. (A,B) hGFAP-cre; BrafCA/+ animals were injection with BrdU at P7 and examined at P12. The total number of Aldh1L1-GFP+ cells in three domains is significantly increased (quantified in B). However, BrdU+ Aldh1L1-GFP+ cells in the mutant spinal cord are not increased compared with control animals. (C) Three EdU injections regimes and quantifications are shown. Increased proliferation of Aldh1L1-GFP+ cells in hGFAP-cre; BrafCA/+ spinal cord is only observed at the P1-3 time period but not in the P6-8 and P13-15 periods. Grey bars represent control whereas white bars are for mutant animals. (D) At P7 and P14, proliferation of astrocytes is assessed by percentage of Ki-67+ Aldh1L1-GFP+ cells in littermates of three genotypes, quantified in the bar graph: (1) BrafCA/+; Ink4a-Arf+/+, Aldh1L1-GFP (control), (2) hGFAP-cre; BrafCA/+; Ink4a-Arf+/+, Aldh1L1-GFP (hGFAP-BRAFV600E) and (3) hGFAP-cre; BrafCA/+; Ink4a-Arf−/−, Aldh1L1-GFP (hGFAP-BRAFV600E; Ink−/−). Note that only at P7, loss of Cdkn2a locus shows significant effect on increasing astrocyte proliferation in BrafCA animals. Statistical analyses are performed by t-test. *P<0.05. Error bars represent s.d. Scale bars: 100 μm.

