Fig. 3.
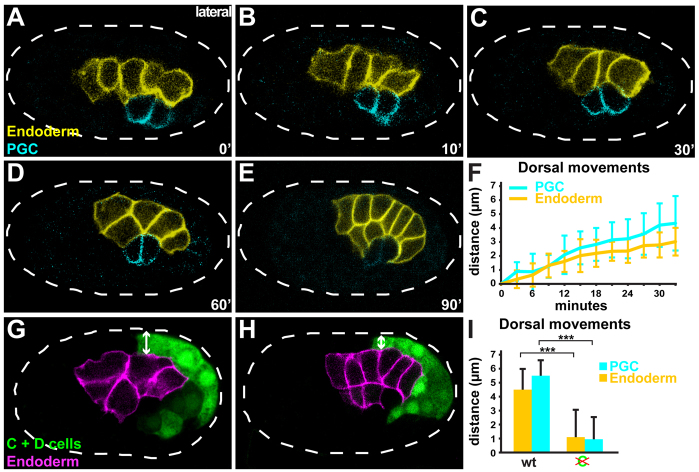
PGC ingression and dorsal movements of endodermal cells. Embryos (~50 μm in length) are oriented anterior towards the left and are shown from the lateral perspective. (A-E) Time-lapse stills of a wild-type embryo expressing PGC-specific (pie-1P::GFP-PAR-2, cyan) and endoderm-specific (end-1P::mCherry-PHPLC∂, yellow) cell surface markers. Time sequence begins just after the birth of Z2 and Z3 (0 minutes), and continues through the period of PGC ingression (A-C). Broken lines mark the eggshell. (B,C) During PGC ingression. (D,E) After PGC ingression, endodermal cells begin to wrap around PGCs. (F) Quantification of dorsal movements of PGCs and endoderm during PGC ingression; error bars indicate s.d., n=6 embryos. (G,H) Wild-type embryo expressing cytoplasmic YFP in C and D lineages (pal-1P::YFP, green) and endoderm-specific mCherry (end-1P::mCherry-PHPLC∂, magenta) localized to the plasma membrane (G, eight E cells; H, 16 E cells). Double-headed arrow indicates the thickness of the dorsal C-cell layer. (I) Quantification of PGC and endoderm dorsal movements following C irradiation (n=6 wild-type embryos, n=10 C-irradiated embryos); primary data are shown in supplementary material Fig. S2. Asterisks indicate a significant difference in distance traveled (***P<0.001, two-tailed Student's t-test).

