
Fig. 6.
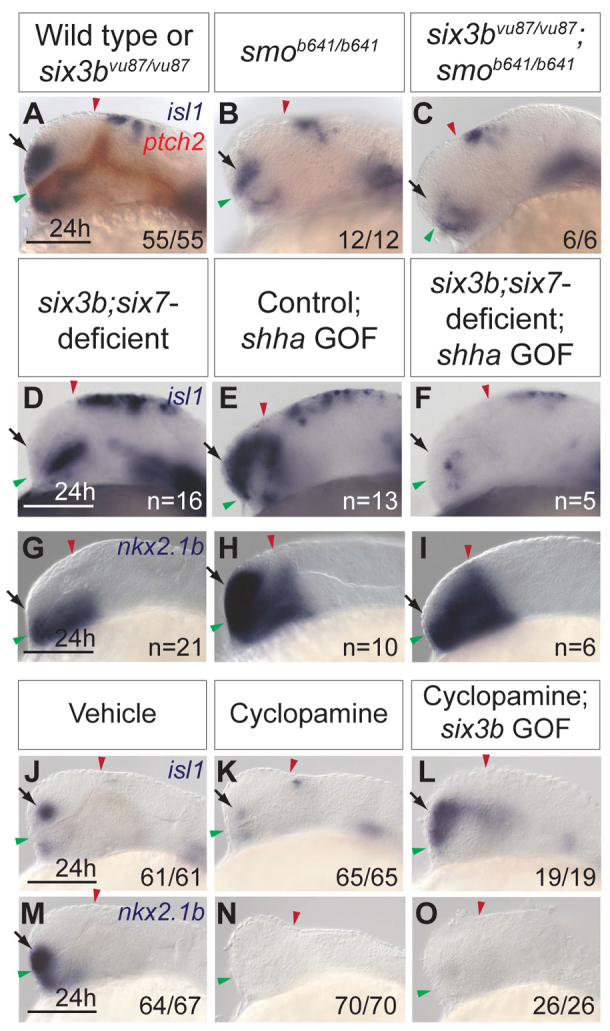
Interactions between Hh signaling and Six3 in ventral telencephalon formation. (A-C) isl1 (purple) and ptch2 (red) expression in wild-type and six3bvu87/vu87 embryos (A), smob641/b641 embryos (B) and six3bvu87/vu87;smob641/b641 embryos (C). (D-I) Expression of isl1 (D-F) and nkx2.1b (G-I) in six3b;six7-deficient embryos (D,G), control Tg(hsp70l:Gal4-VP16); Tg(UAS:shha-NH-EGFP) embryos misexpressing shha-NH-EGFP (E,H) and six3b;six7-deficient Tg(hsp70l:Gal4-VP16); Tg(UAS:shha-NH-EGFP) embryos misexpressing shha-NH-EGFP (F,I). (J-O) isl1 (J-L) and nkx2.1b (M-O) expression in vehicle-treated embryos (J,M), cyclopamine-treated embryos (K,N) and cyclopamine-treated Tg(hsp70l:Gal4-VP16); Tg(UAS:six3b) embryos misexpressing six3b (L,O). All embryos are 24 hpf. Embryos are shown in lateral view with anterior towards the left. Red and green arrowheads indicate dorsal and ventral edges of the telencephalon, respectively. Arrows indicate ventral telencephalon. Scale bars: 100 μm.