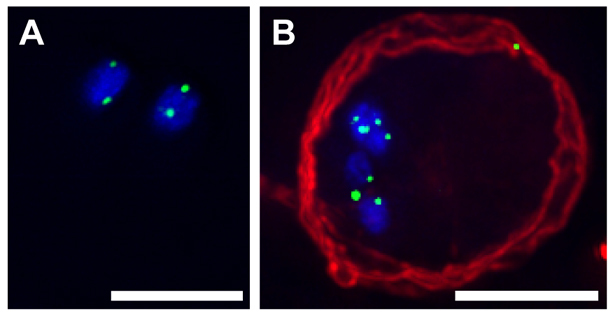
Fig. 5.

Telomere clustering in trophozoites and cysts. FISH was performed on trophozoites (A) and cysts (B), using a probe to label the telomeric repeat sequence. DAPI-stained DNA is shown in blue, the telomere probe is shown in green and antibody staining against cyst wall protein is shown in red. Scale bars: 5 μm.
