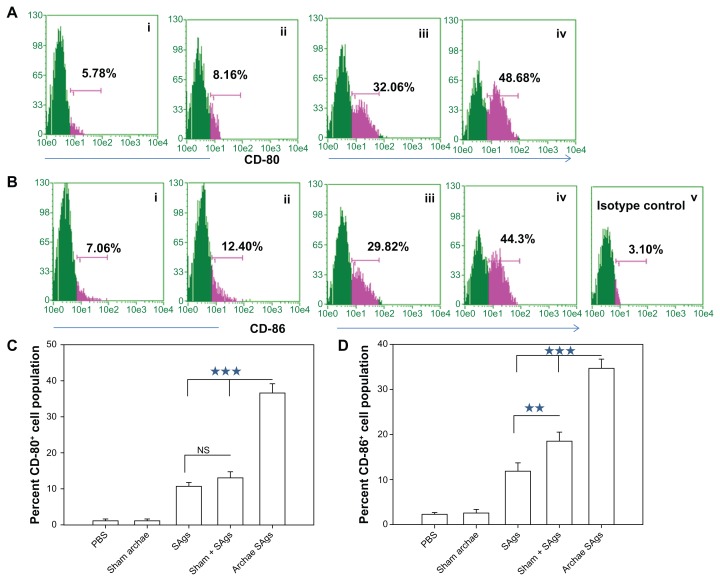
Figure 6.
Archaeosome-entrapped SAgs upregulate the expression of costimulatory molecules on antigen-presenting cells. The expression of costimulatory molecules, CD80 (B7-1) and CD86 (B7-2), on macrophages was determined by staining target cells with specific antibodies and subsequent analysis by flow cytometry at 2 weeks post-challenge. The dot plot graphs for (A) CD80 and (B) CD86 represent various immunized groups: (i) Sham archaeosomes as control; (ii) free culture supernatant SAgs; (iii) Sham + SAgs as a physical mixture; (iv) Archaeosome-entrapped culture supernatant SAgs and (v) and isotype control. The bar graphs corresponding to (C) CD80 and (D) CD86 depict the mean percentage of three determinants (±SD).
Notes: Data were analyzed with Student’s t-test and are representative of three independent experiments. Archaeosome-entrapped SAgs vs free SAgs ***P < 0.001 (CD80), ***P < 0.001 (CD86); physical mixture vs free SAgs P = NS (CD80), **P < 0.01. The CD80/86 population histogram was same as that of sham archaeosome and is not shown.
Abbreviations: PBS, phosphate buffer saline; SD, standard deviation; SAgs, secretory protein antigens; NS, not significant.

