
Figure 1.
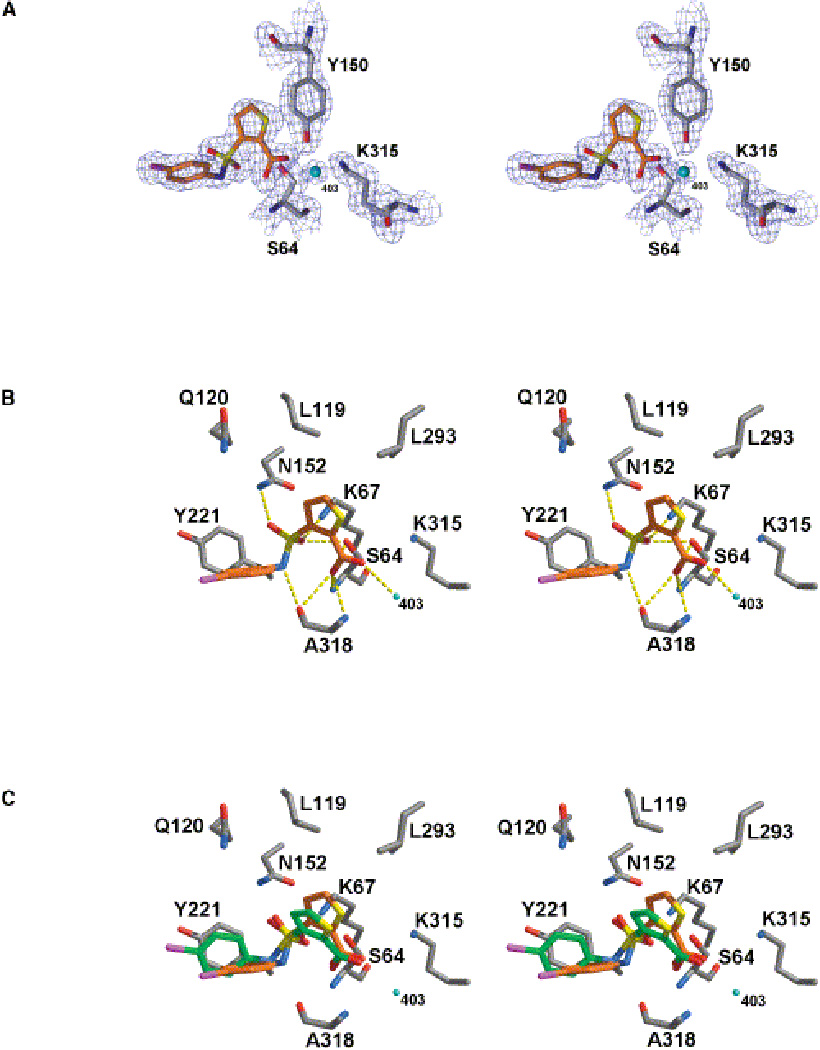
Stereo View of the Active Site Region of the AmpC/1 Complex Determined to 1.94 Å Resolution. (A) The 2Fo-Fc electron density map is shown in blue, contoured at 1.0 σ. This figure was made with SETOR [41]. (B) Interactions observed between AmpC and compound 1 in the crystallographic complex. Cyan spheres represent water molecules. Dashed yellow lines indicate hydrogen bonds. Atoms are colored as in Figure 2, except that the carbon atoms of compound 1 are colored orange.(C) Overlay of the docked and crystallographic conformations of compound 1 in the AmpC site. Carbon atoms of compound 1 in the docked conformation, green; carbon atoms of compound 1 in the crystal structure, orange. (from Ref. [19])