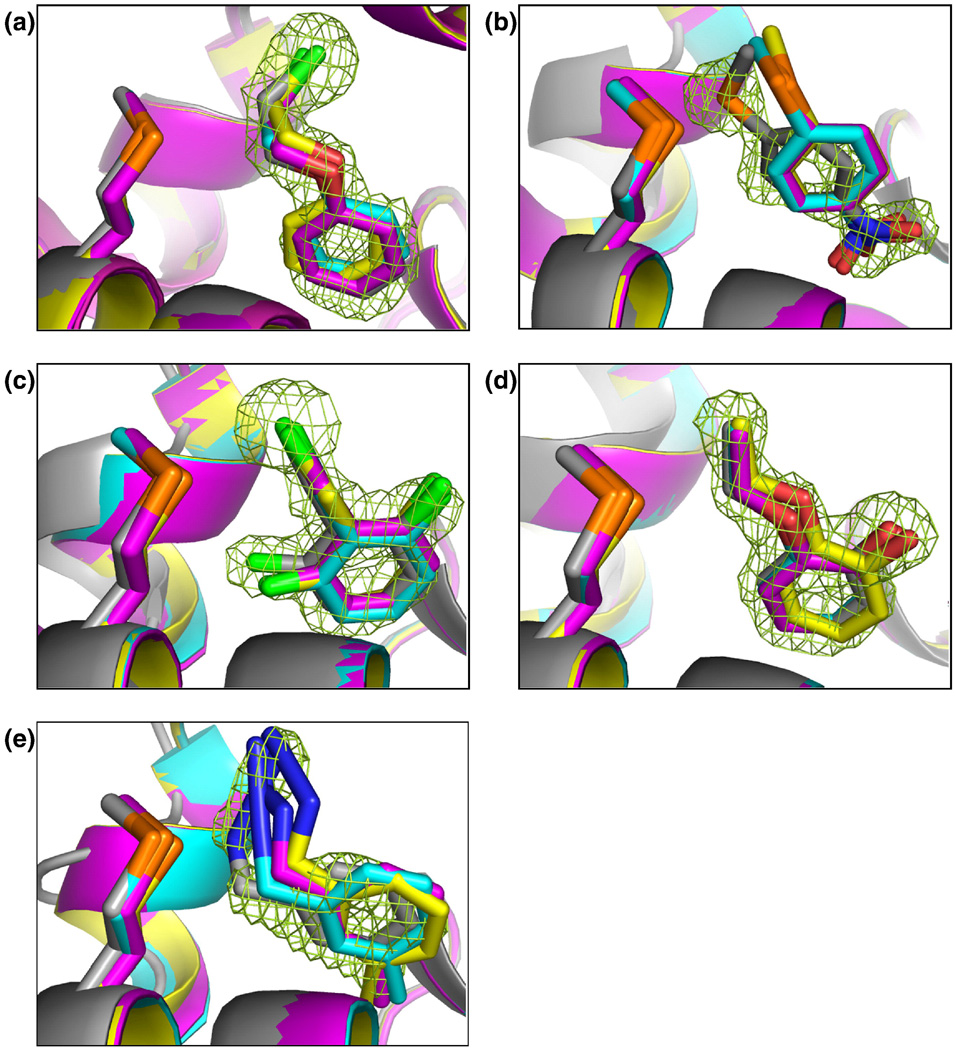
Figure 5.
Crystal structures of selected ligands from Table 2 bound to CCP W191G. Part 3 of the original figure only. Left column: |Fo|-|Fc| omit map for the refined complexes, except for (a), (c), (k), (m), and (y) where the map of the unrefined complex is shown, contoured at 2.5 σ (green) with the ligand left out of the calculation, but shown in the Figure for clarity. Right column: Superposition of the highest ranking dock pose (green carbon atoms) with the crystallographically determined binding mode (yellow carbon atoms). Hydrogen bonds are drawn as broken lines. (a) and (b) 14; (c) and (d) 15; (e) and (f) 16; (g) and (h) 17; (i) and (j) 18; (k) and (l) 21, the |Fo|-|Fc| map, contoured at 10 σ (red) is also shown; (m) and (n) 22; (o) and(p) 24; (q) and (r) 25, the |Fo|-|Fc| map, contoured at 9 σ (red) is also shown; (s) and (t) 28; (u) and (v) 33, the |Fo|-|Fc| map, contoured at 14 σ (red) is also shown; (w) and (x) 34; (y) and (z) 35; (aa) and (bb) 36. (from Ref. [27])

