
Table 2.
The matrix of cross-enrichments. The color-coded table unit presents poor (white), medium (green), good (red) and very good enrichment (black). Dark boxes are drawn around related targets (Nuclear hormone receptors, kinases, serine proteases, metallo-enzymes, folate enzymes, and other enzymes).
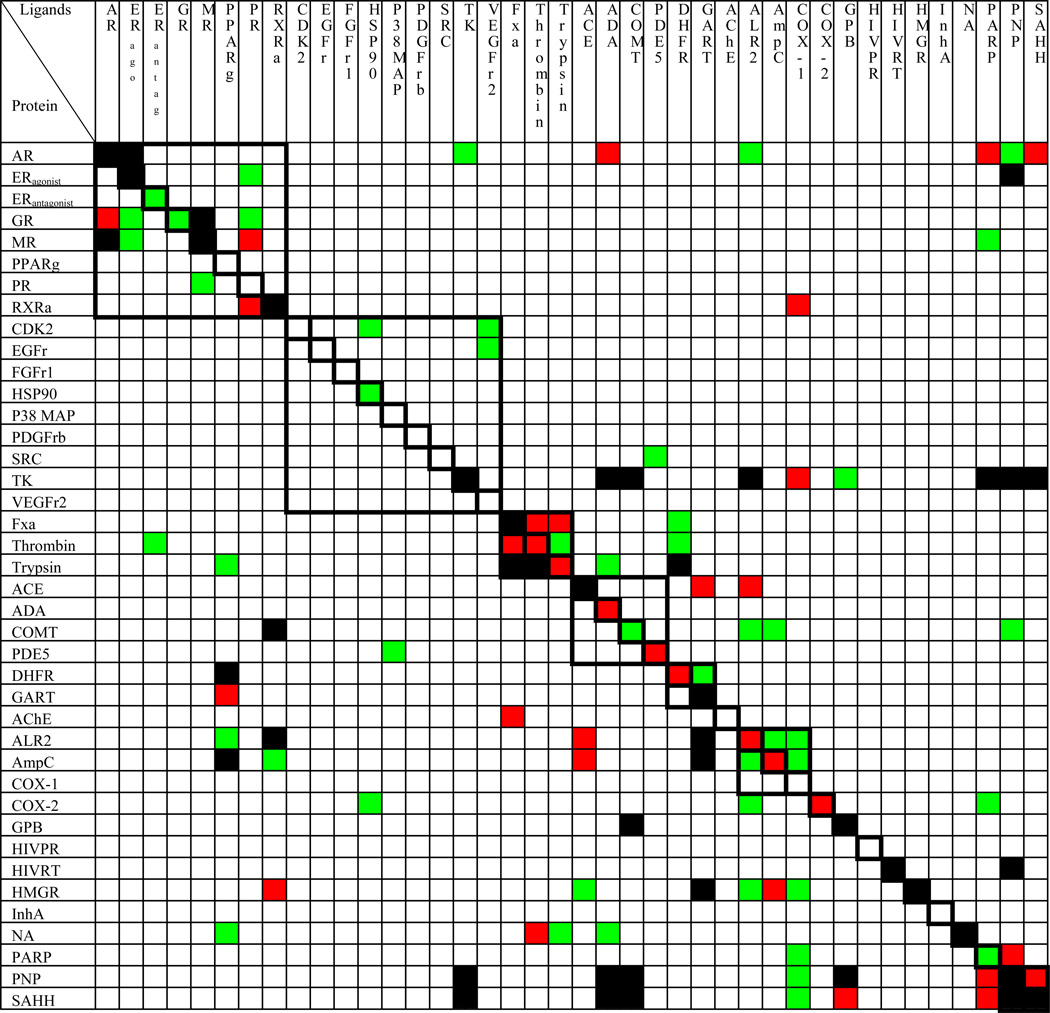 |
Very good (ETmax ≥ 30 and ET20 ≥ 3), good (30 > ETmax ≥ 20 and 3 > ET20 ≥ 2.5), medium (20 > ETmax ≥ 10 and 2.5 > ET20 ≥ 2) and poor (ETmax < 10 and ET20 < 2). The only exception is when one of the two enrichment indicators is well above the defined cutoff while the other is marginally below the defined cutoff, and then an averaged enrichment performance is assigned to compensate it.