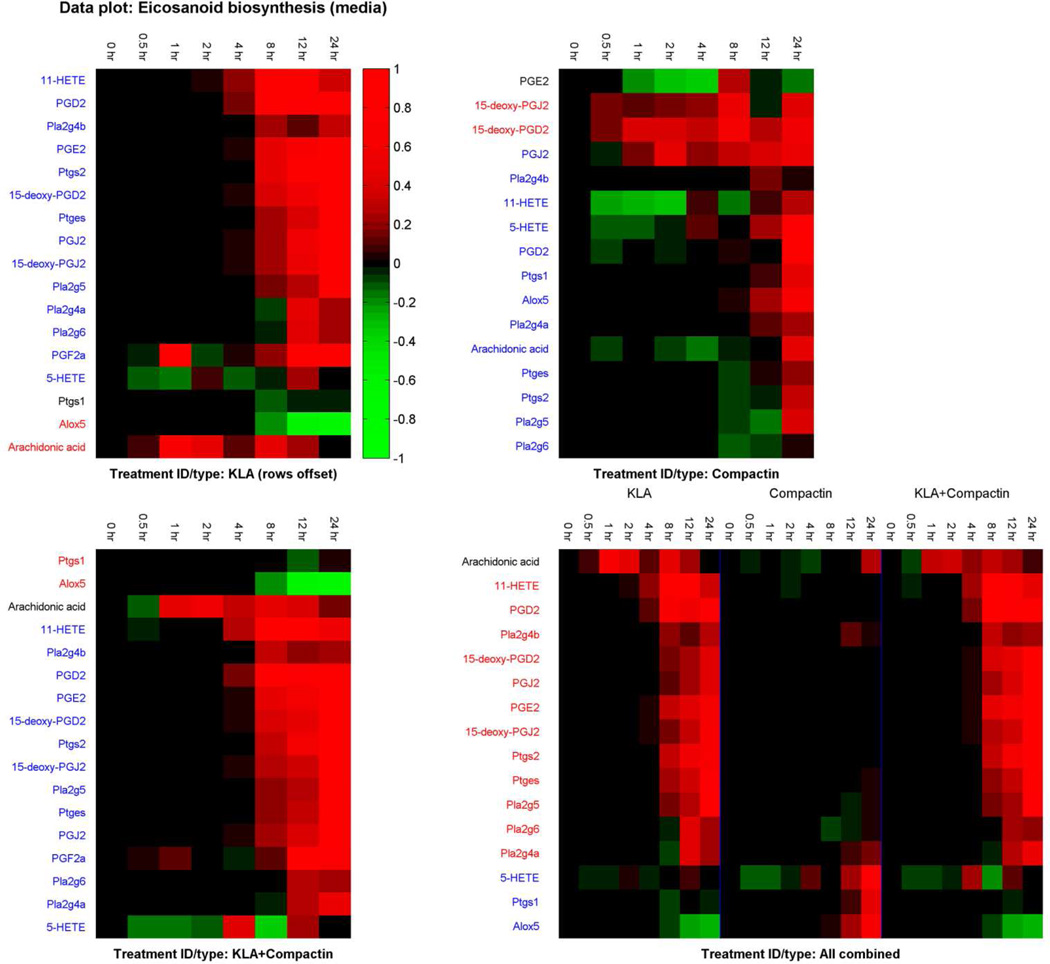
Figure 24.
Heat map for the data for eicosanoids (measured in the media) and eicosanoid biosynthesis related genes (Reprinted with permission from Reference 2. Copyright 2010 American Society for Biochemistry and Molecular Biology). The four panels correspond to: (1) Data based on ratio of values for treatment with KLA to the values for control experiments, (2) ratio of compactin treatment to control, (3) ratio of treatment with both KLA and compactin to control, and (4) ratio data from (1)–(3) combined. The data in each row is scaled and offset by the t = 0 value. The names of the lipids/genes displayed on the y- and/or x-axis are listed in different colors to indicate the clusters.

