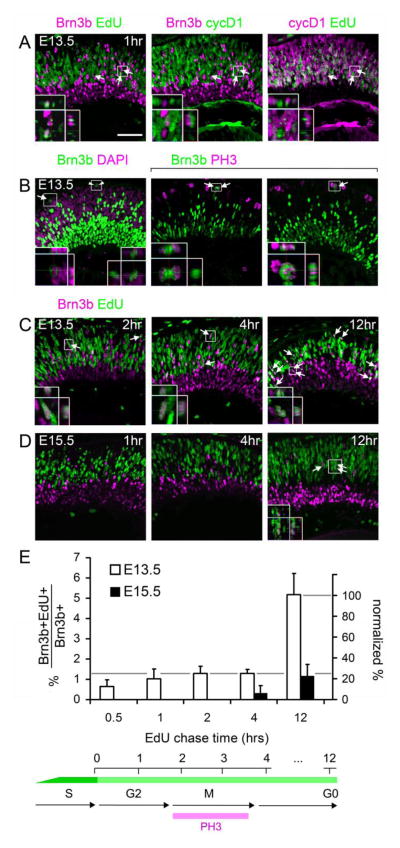
Fig. 3.
The onset of Brn3b and Isl1 expression within individual cells is progressively delayed during retinal development. (A) Sections from E13.5 embryos co-stained for Brn3b, cyclinD1 (cycD1) and EdU following a 1 hr chase. In some cells, Brn3b is co-localized with EdU (arrows), but not with the G1/early-S phase marker cycD1, indicating that Brn3b expression initiates in late S or G2 phase. Insets show two cells that are Brn3b+ EdU+ cyclinD1−. The orthogonal (Y–Z) views demonstrate the importance of the confocal Z-stack for distinguishing adjacent cells. One cell has a punctate EdU staining pattern, indicating incorporation in late-replicating DNA regions at the end of S phase. (B) Sections from E13.5 embryos stained for Brn3b and the mitotic marker PH3 or the nuclear counterstain DAPI. Brn3b+ cells in M phase (arrows) and presumptive daughter pairs (arrowheads) are indicated. (C–D) Sections from E13.5 or E15.5 embryos co-stained for Brn3b and EdU following the indicated chase period. At E13.5 (C), many newly generated Brn3b+ cells are co-labeled with EdU after a 2, 4 or 12 hr chase. By 12 hrs, some EdU-labeled cells migrate to the nascent GCL, and many Brn3b+ EdU+ cells are in close proximity as presumptive daughter pairs. At E15.5 (D), no Brn3b+ EdU+ cells are observed after 1 hr chase, and very few are detected after a 4 hr chase, but Brn3b+ EdU+ are readily detected after a 12 hr chase (arrows). (E) Quantitative analysis of Brn3b and EdU co-labeling. The abundance of co-labeled cells is plotted as a percentage of all Brn3b+ cells (left scale) or neurogenic Brn3b+ cells (right scale, normalized to the 12 hr chase value at E13.5). Approximately 30% of newly Brn3b+ cells initiated expression prior to cell cycle exit at E13.5 (gray line). In contrast, few Brn3b+ cells are co-labeled with EdU prior to 12 hrs at E15.5, indicating that RGCs are specified later at this developmental stage. Scale bar, 50 μm.

