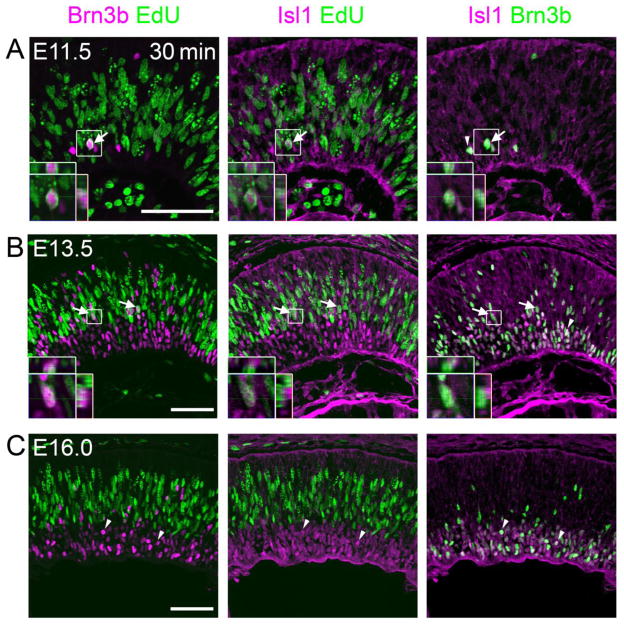
Fig. 4.
Co-expression of Brn3b and Isl1 during or shortly after the terminal cell cycle. (A–C) Sections from E11.5, E13.5, and E16.0 embryos co-stained for Brn3b, Isl1 and EdU following a 30 min chase. At E11.5 (A) and E13.5 (B), multiple Brn3b+ Isl1+ EdU+ cells are observed (arrows), indicating that RGC markers can initiate expression prior to cell cycle exit, in late S or G2 phase. In contrast, at E16.0 (C), all Brn3b+ Isl1+ cells are EdU− (examples marked by arrowheads). The insets show orthogonal Z-stack views of magnified Brn3b+ Isl1+ EdU+ cells. Scale bar, 50 μm.

