Figure 3.

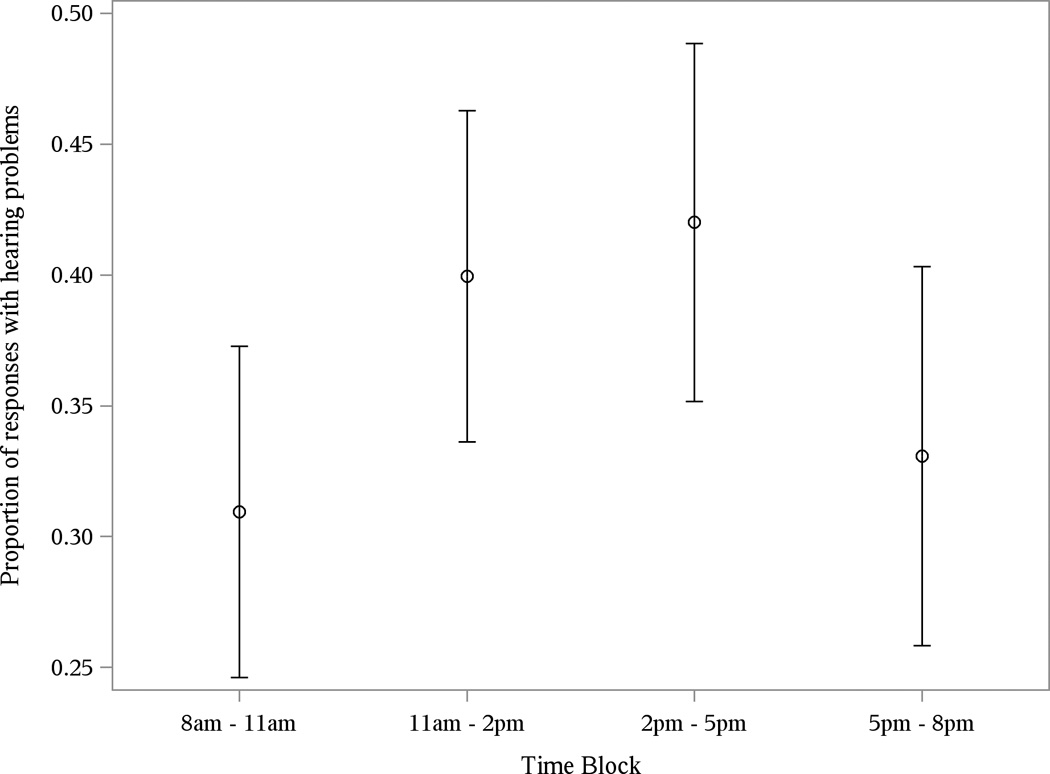
Mean proportion of responses indicating a hearing problem situation by time block. This figure shows within-day variability of the proportion of responses where problems were reported. The bars indicate the standard error of the mean.

Mean proportion of responses indicating a hearing problem situation by time block. This figure shows within-day variability of the proportion of responses where problems were reported. The bars indicate the standard error of the mean.