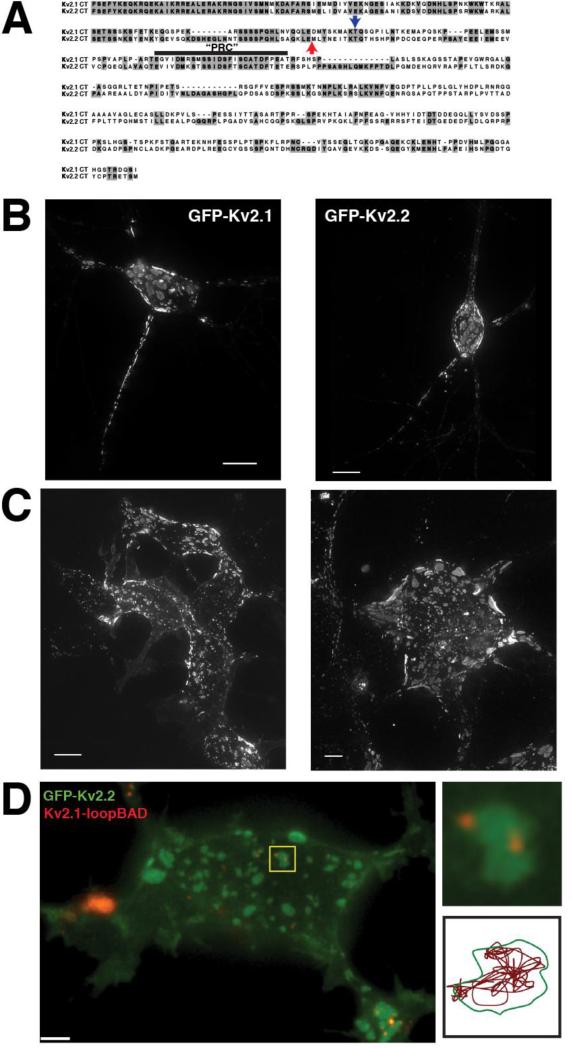
Figure 2. Clustering of Kv2.1 and Kv2.2 is governed by a mechanism common to both channels.
A. Sequence alignment of the C-termini of Kv2.1 and Kv2.2. The blue arrow indicates the point at which Kv2.1 is truncated in the Kv2.1ΔC318 construct. There are 98 residues remaining past the S6 domain (of a total of 416). The red arrow indicates the beginning of the sequence of the soluble Kv2.2CT. B. Expression of GFP-Kv2.1 (left) and GFP-Kv2.2 (right) in cultured rat hippocampal neurons. C. Expression of GFP-Kv2.1 (left) and GFP-Kv2.2 (right) in HEK293 cells. Images in B and C are maximum intensity projections of XYZ stacks. D. (left) Coexpression of GFP-Kv2.2 and Kv2.1-loopBAD (red) in HEK293 cell. Kv2.1-loopBAD was visualized by labeling with streptavidin-conjugated QD605. Image is a single Z-section of the basal surface of the cell. (Top right) Enlarged image of the cluster highlighted by the yellow box illustrating a GFP-Kv2.1 cluster containing 2 QD-labeled Kv2.1 channels. (Bottom right) Single particle track of one of the QD in the cluster illustrating that Kv2.1 channels obey the same cluster boundary as Kv2.2.

