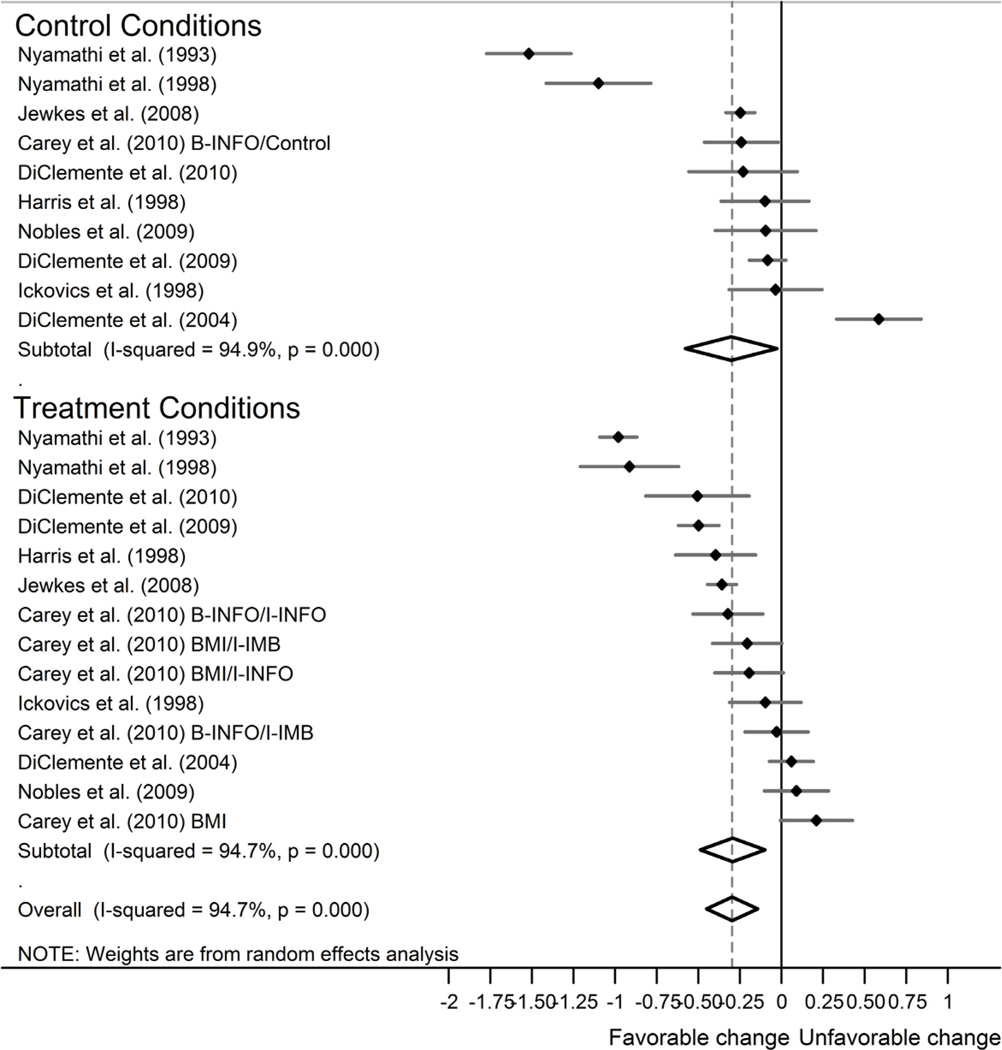
Figure 2.
Forest plot of effect sizes gauging sexual risk from baseline to the last available follow-up, grouped by condition and ordered by magnitude. Negative (positive) effect sizes correspond to a decrease (increase) in sexual risk. Confidence intervals (lines) for each effect size are significant when they do not include zero. Weighted mean effect sizes (diamonds) show a significant decrease in sexual risk behavior for each combination of conditions.

