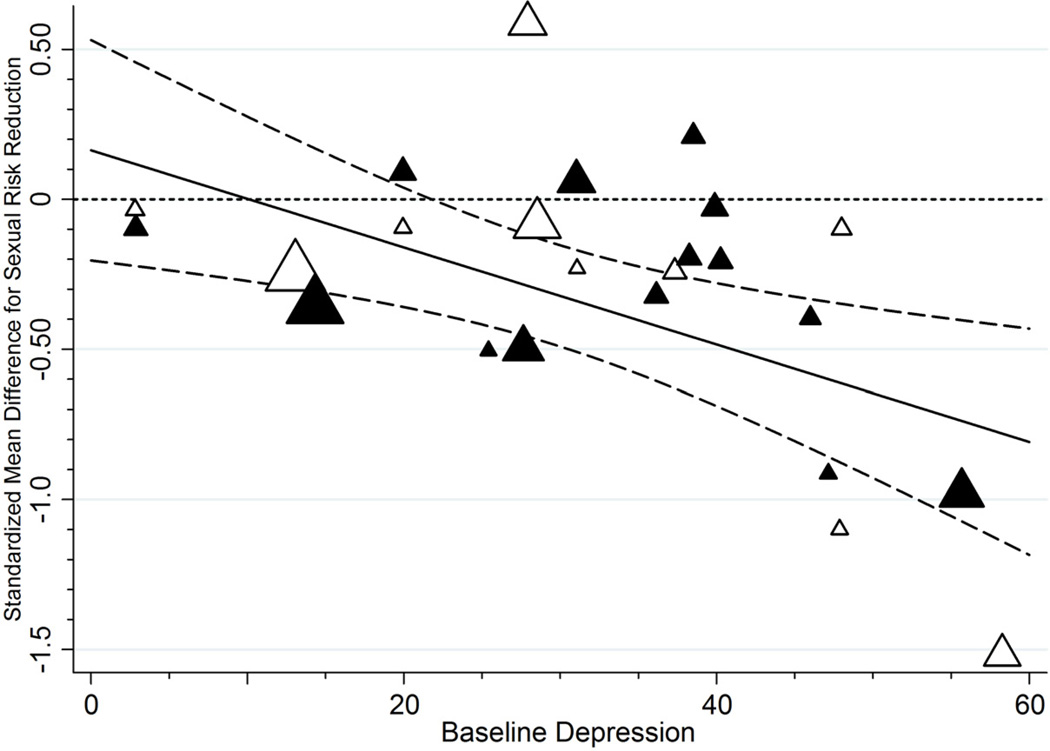
Figure 4.
Sexual risk reduction as a function of baseline depression. Sexual risk behavior declined following the intevention at the last available follow-up to the extent that samples had higher levels of baseline depression (treatment [control] group effects appear as black [white] triangles; the size of each plotted value reflects its weight in the analysis). The solid regression line indicates trends across initial levels of depression; dashed lines provide 95% confidence bands for these trends.

