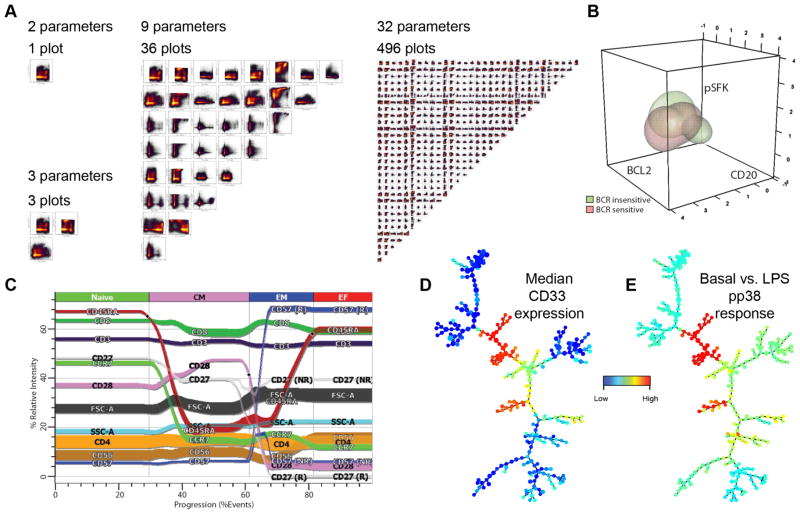
Figure 5. Complexity of multidimensional single-cell analysis.
(a) “Human interpretable” two-(D)imensional scatter plots are not a scalable solution in single-cell analysis. As the number of single cell parameters increases, the number of unique 2D plots increases exponentially. (b) FLAME analysis of B lymphocytes. Clustered cell events graphically displayed for visual comparison of receptor signaling cell populations. (c) Gemstone analysis of CD8 T cells showing progression of phenotypic markers including branching expression of markers like CD57 D–E) SPADE plots representing clusters of cells in normal human bone marrow. D) is the expression of CD33 (monocytes) across all cell clusters. (e) is the level of phosphor p38 (pp38) measured in response to LPS stimulation and normalized to an unstimulated (basal) control.

