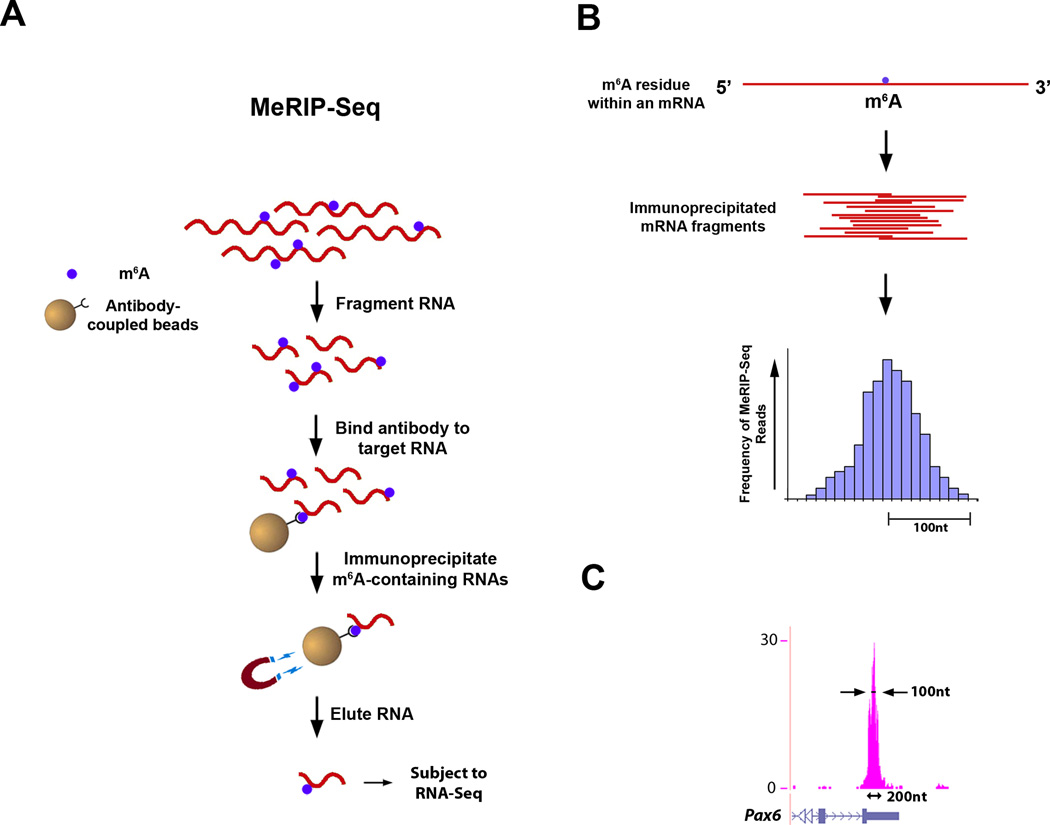
Figure 4. Outline of MeRIP-Seq Protocol and Distribution of Sequencing Reads.
A. Schematic representation of MeRIP-Seq. Total RNA is subjected to RiboMinus treatment to remove rRNA species. RNAs containing m6A are then immunoprecipitated by mixing the RNA with m6A antibody-coupled Dynabeads. m6A-containing RNAs are then eluted from the antibody-coupled beads and subjected to a second round of m6A immunoprecipitation. The resulting RNA pool, which is highly enriched for m6A-containing RNAs, is then subjected to next-generation sequencing.
B. Schematic of sequencing reads and their alignment to locations in the genome surrounding an m6A site. Top: an mRNA that contains a single m6A residue along its length. Middle: individual 100 nt-wide mRNA fragments which are isolated following m6A immunoprecipitation, each of which contains the same m6A residue from the mRNA depicted above. Bottom: histogram showing predicted frequency of MeRIP-Seq reads obtained by sequencing individual immunoprecipitated fragments. Read frequency is predicted to increase with closer proximity to the m6A site, forming a “peak” which is roughly 200 nt wide at its base and 100 nt wide at its midpoint.
C. Sequencing reads from MeRIP-Seq converge over m6A sites. Representative UCSC Genome Browser plot from MeRIP-Seq data which demonstrates typical read frequency peak formation surrounding a site of m6A (shown here is the 3’ UTR of Pax6). Peak height is displayed as reads per base per million mapped reads (BPM).
See also Figures S2, S3.

