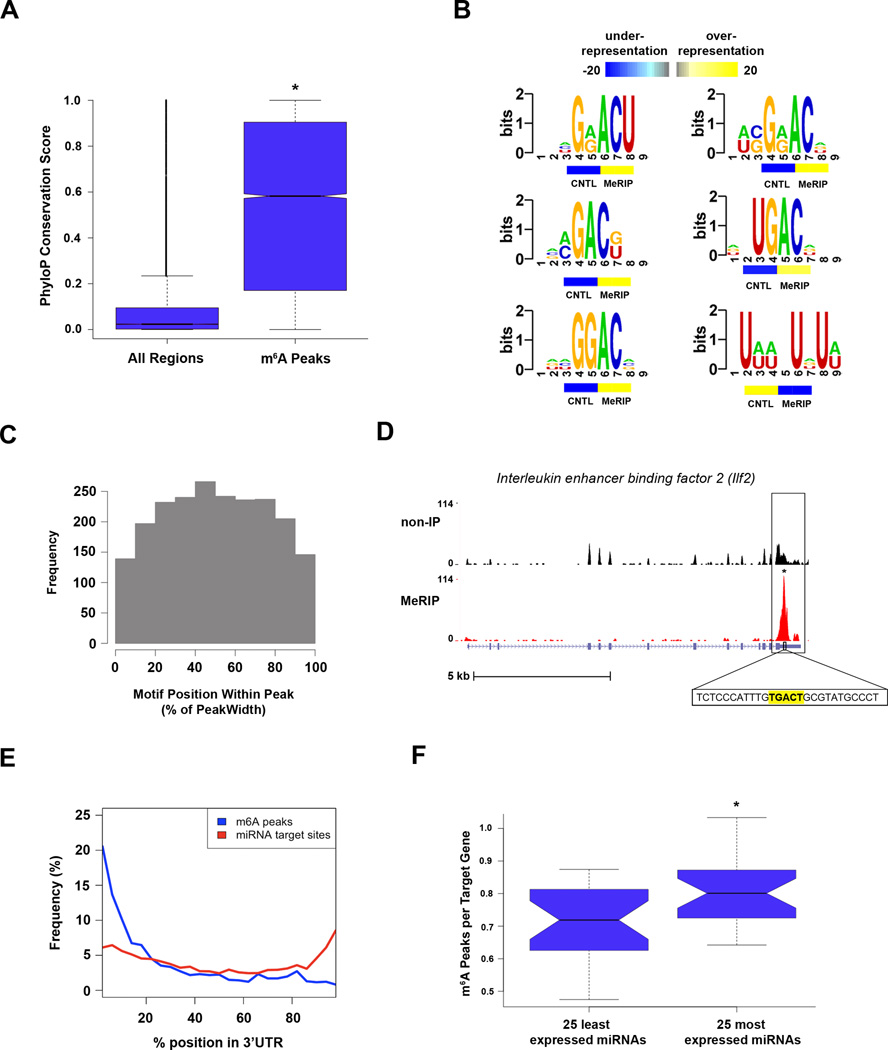
Figure 6. MeRIP-Seq Reveals Features of m6A in mRNA.
A. Phylogenetic conservation of m6A peaks. PhyloP scores of m6A peak regions were compared to those of randomly shuffled regions throughout gene exons. There was a significantly higher median conservation score (K-S test, * p ≤ 2.2e−16) in m6A peaks (0.578) than in the random regions (0.023).
B. Sequence motifs identified within m6A peaks. The motif G[AG]ACU and variants thereof ([AC]GAC[GU], GGAC, [AU][CG]G[AG]AC, and UGAC) was highly enriched in m6A peaks. Additionally, one U-rich motif (bottom right) was identified as being significantly underrepresented within m6A peaks. Color bars under each motif indicate the degree of underrepresentation (blue) or overrepresentation (yellow) within regions of m6A peaks in the non-IP control sample (CNTL) and the MeRIP sample (MeRIP).
C. m6A motif sequences frequently lie near the center of m6A peaks. Shown is a plot of the cumulative distribution of m6A motif positions within m6A peaks containing a single motif. Motifs cluster in the center of peaks, suggesting that the methylated adenosines in these motifs account for the m6A peaks identified in MeRIP-Seq.
D. Example of a m6A motif sequence near the center of a peak. UCSC Genome Browser plot containing tracks for MeRIP-Seq reads (red) and non-IP control reads (black) at the Ilf2 locus. The m6A peak within the Ilf2 3’ UTR contains a single m6A motif identified in (B). The sequence of this motif (highlighted in yellow) is located at the center of the m6A peak.
E. Distribution of m6A peaks and miRNA target sites within 3’ UTRs. The frequency of m6A peaks (blue) and miRNA target sites (red) along the length of 3’ UTRs is shown.
F. Association between 3’ UTR methylation and miRNA abundance. The 25 most abundant miRNAs in brain have a significantly greater percentage of m6A peaks within their target mRNA 3’ UTRs than do the 25 most weakly expressed brain miRNAs (*p<0.05, Wilcoxon test). The error bars in A and F indicate the highest and lowest values, and the box boundaries denote the 1st quartile, median, and 3rd quartile.
See also Figures S3, S6, and S7.

