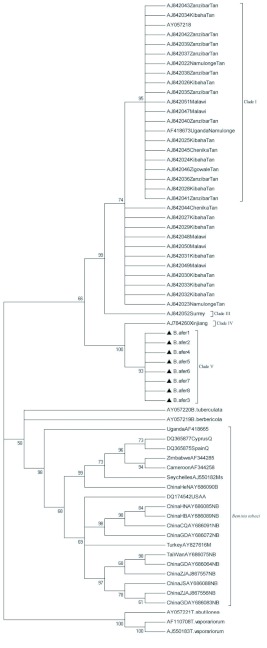
Figure 1.
ME (Minimum Evolution) tree based on ∼600-bp fragment of the mtCOI sequences. Numbers at nodes indicate bootstrap scores using 1000 replicates. Abbreviations are as described in Table 1.  indicates sequences obtained in this study. High quality figures are available online.

