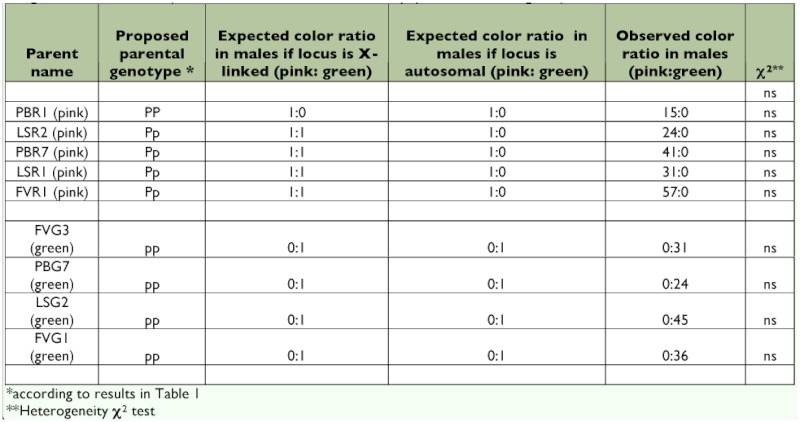
Table 2.
Color morph production in males (X0) for 5 pink sexuparae (XX) and 4 green sexuparae (XX).
The χ2 compares the observed colour ratio in males produced by these sexuparae to the expected colour ratio in males under the genetic model tested (one autosomal locus, 2 alleles P and p, pink dominant to green).