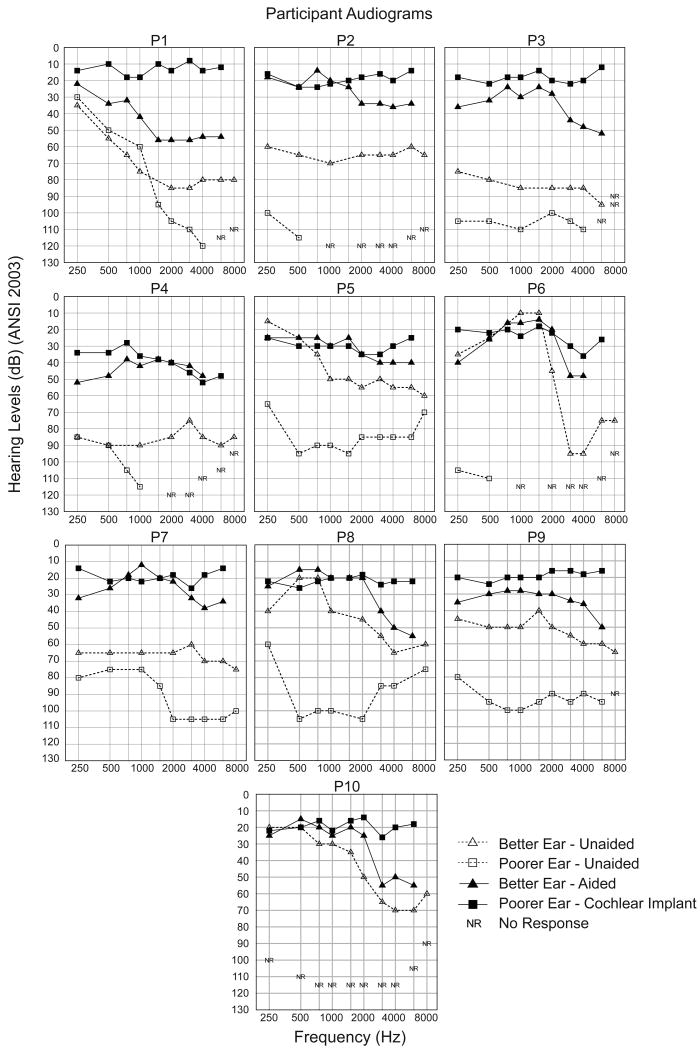
Figure 1.
Individual audiometric thresholds as a function of frequency are shown for each participant. Unaided thresholds are open symbols with dashed lines, the better ear as triangles and the poorer ear as squares. Aided better ear thresholds are filled triangles with solid lines. Poorer ear post-implant thresholds with a CI are filled squares with solid lines.

