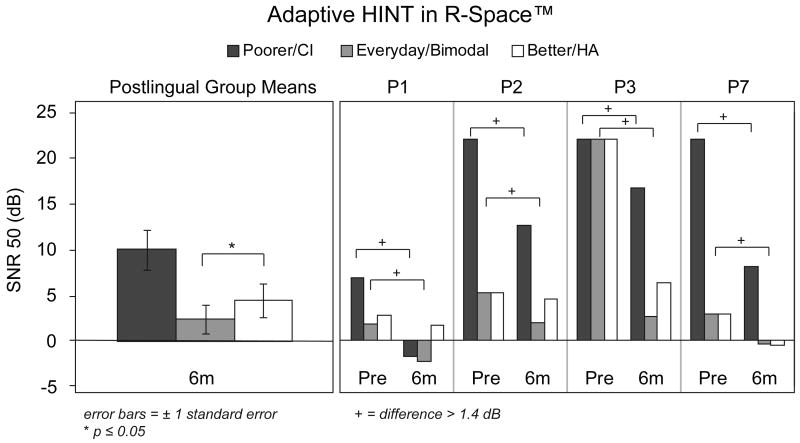
Figure 3.
Group mean adaptive HINT scores in restaurant noise at the six-month interval for all postlingual participants are shown in the left panel. Individual participants' scores are shown in the right panel for the four participants who had both pre- and post-implant testing. Scores are expressed as SNR and are shown in black for the poorer hearing ear that was implanted, in white for the better hearing ear with a HA, and in gray for the participants' everyday listening condition (bimodal at the post-implant interval).

