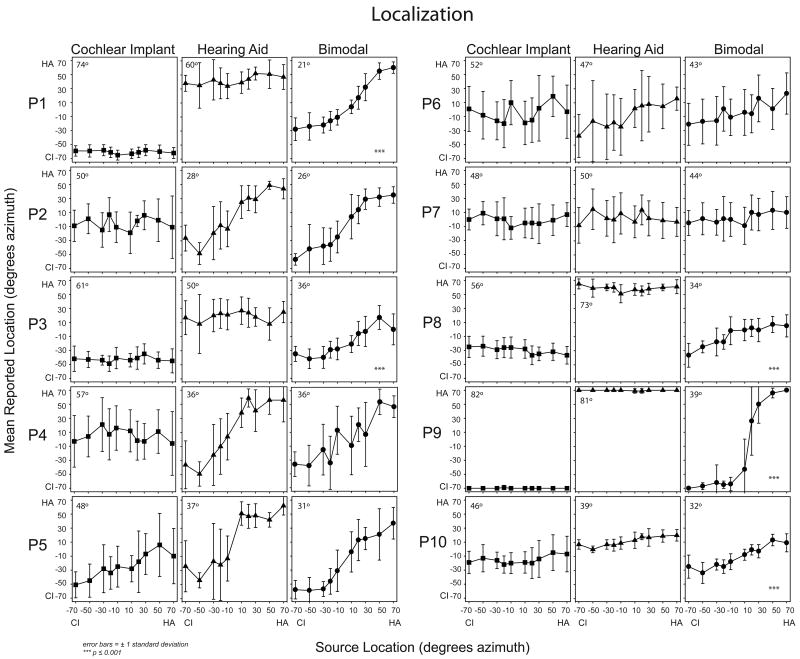
Figure 7.
Individual participants' localization results are shown for the conditions CI-alone (filled squares, left panels), HA-alone (filled triangles, middle panels), and bimodal (filled circles, right panels) at six months post-implant. Symbols represent mean responses in degrees azimuth. X-axis represents the location of the stimuli and the Y-axis, the location of the response. The RMS error score for each participant and condition is noted in the upper left hand corner of each panel. Significant differences between the HA-alone and bimodal conditions are indicated with asterisks in the lower right hand corner of the bimodal panels.

