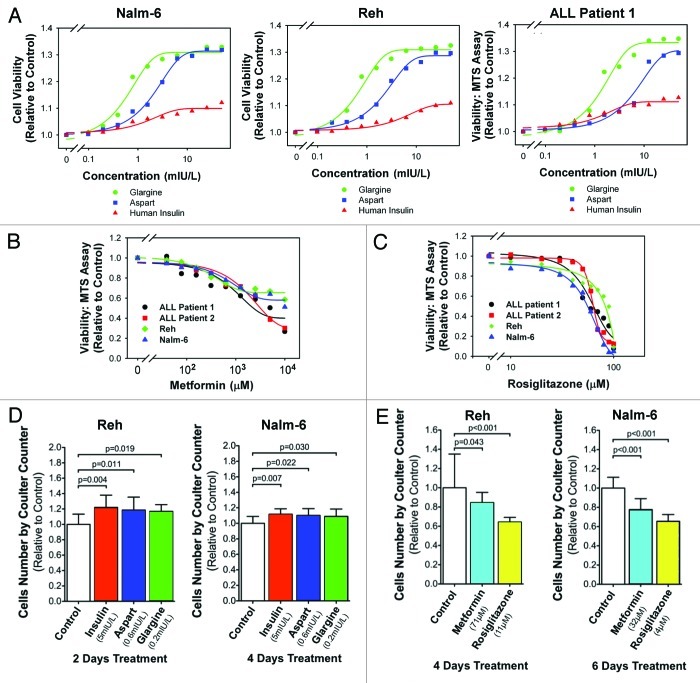
Figure 1. Differential effects of diabetes medications on leukemic cell proliferation. (A) The cell viability was measured by the MTS assay. The cell viability relative to the control samples was plotted against the concentration of human insulin (red), glargine (green) or aspart (blue). Insulin and analogs increased the number of live ALL cells. Glargine and aspart stimulated ALL cells more than human insulin at equal IU concentrations (i.e., equi-hypoglycemic). (B) The viability relative to control was measured as in (A). Representative log-dose response curves are shown. Metformin inhibited ALL cell lines and primary patient samples (see color key). (C) Similar to (B), representative log-dose response curves demonstrating the inhibitory effect of rosiglitazone are shown (see color key for ALL cell lines and primary patient samples). (D) Reh and Nalm-6 cells were incubated for 2 and 4 d, respectively, with insulin (5 mIU/L, red bar), aspart (0.6 mIU/L, blue bar) or glargine (0.2 mIU/L, green bar), and a Coulter counter was used to count cells. Error bars represent 95% confidence intervals (n = 4). p-values (one-way ANOVA, post-hoc intergroup comparisons) indicate significant increases in the cell number relative to control (white bar). (E) Reh cells were treated for 4 d with metformin (71 µM, blue bar) or rosiglitazone (11 µM, yellow bar). Nalm-6 cells were treated for 6 d with metformin (32 µM, blue bar) or rosiglitazone (4 µM, yellow bar). Cell numbers were counted using a Coulter counter. Error bars represent 95% confidence intervals (n = 4). P-values (one-way ANOVA, post-hoc intergroup comparisons) indicate significant decreases in the cell number relative to control (white bar).

An official website of the United States government
Here's how you know
Official websites use .gov
A
.gov website belongs to an official
government organization in the United States.
Secure .gov websites use HTTPS
A lock (
) or https:// means you've safely
connected to the .gov website. Share sensitive
information only on official, secure websites.
