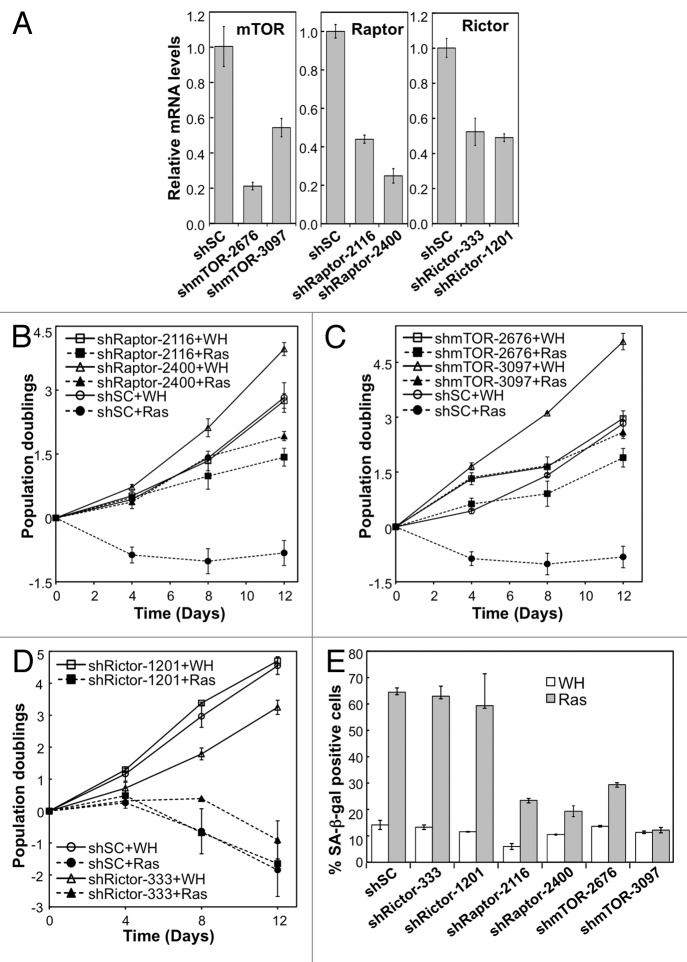
Figure 4. Depletion of TORC1, but not TORC2 subunits disrupts RAS-induced senescence. (A) BJ fibroblasts transduced with shRNA against TOR, Raptor, Rictor or with scrambled (shSC) shRNA. Relative mRNA levels determined by qRT-PCR. (C-D) TOR-depleted, Rictor-depleted, or Raptor-depleted cells infected with either HRAS-V12 or empty vector control (WH) and passaged for 12 d. Total population doublings displayed on the Y-axis. Slope of the curve indicates growth rate. Left panel: staining of SA-β-gal of RAS-induced or control cells. (E) SA-β-gal of Rictor, Raptor, TOR-depleted cells.

An official website of the United States government
Here's how you know
Official websites use .gov
A
.gov website belongs to an official
government organization in the United States.
Secure .gov websites use HTTPS
A lock (
) or https:// means you've safely
connected to the .gov website. Share sensitive
information only on official, secure websites.
