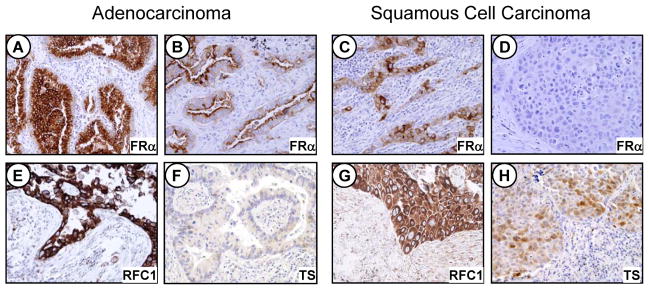
Figure 1.
Photomicrographs showing immunohistochemical expression of FRα, FRC1 and TS in NSCLC tissue specimens by histologic type. FRα: A, strong cytoplasmic and membrane expression in tumor cells; B and C, moderate expression in tumor cells; D, lack of expression in malignant cells. RFC1: E and G, strong cytoplasmic expression in malignant cells. TS: F and H, negative and moderate cytoplasmic and nuclear expression in tumor cells, respectively. Original magnification, ×200.

