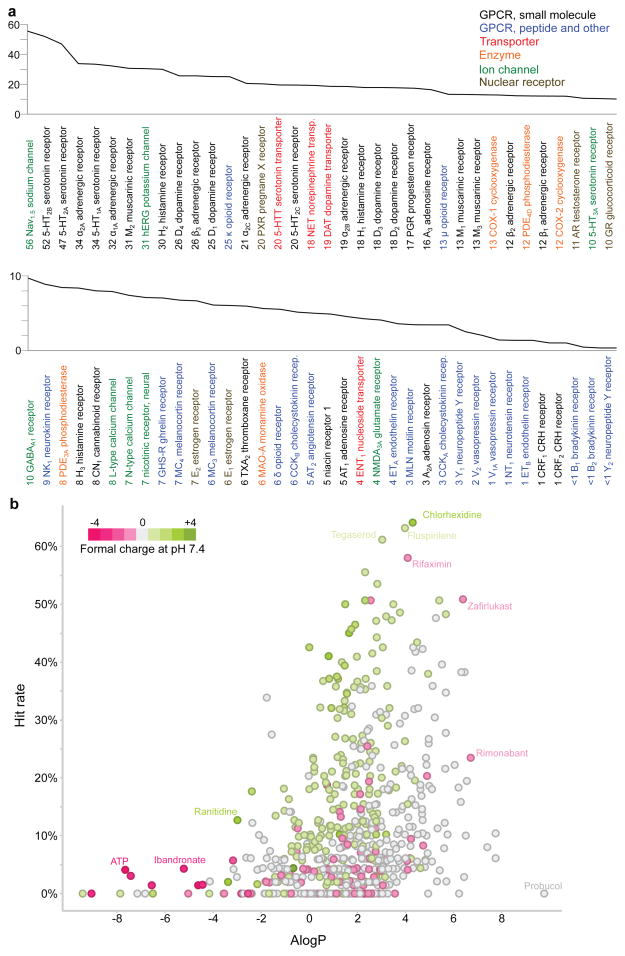
Figure 3. Target and drug promiscuity.
(a) Target promiscuity. Targets are sorted based on the percentage of drugs hitting the target below 30 μM (indicated by numbers next to target names). Colors code for seven distinct target classes. (b) Promiscuous drugs are often hydrophobic and cationic. Each point represents one drug. Ionization at pH 7.4 and ALogP values were calculated from drug structures. Hit rate: percentage of targets the drug binds below 30 μM.

