
Table 1.
New drug-off-target predictions confirmed by in vitro experiment. Representative, confirmed predictions are shown.
| Drug | Closest ChEMBL Molecule | Tca | Target | SEA E-value | IC50 [μM] | Closest known targetb | BLAST E- valuec |
|---|---|---|---|---|---|---|---|
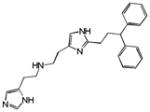
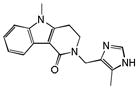 Alosetron |
|
0.25 | HTR2B | 1.6×10⁻¹⁷ | 0.02 | KCNH7 | 3.6e+2 |
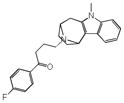
 Aprindine |
|
0.38 | HRH1 | 5.0×10⁻²⁶ | 0.78 | SCN5A | 3.3e−1 |
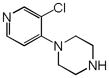
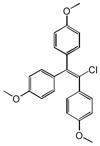 Chlorotrianisene |
|
0.31 | PTGS1 | 1.9×10⁻¹⁷ | 0.16 | ESR1 | 9.0e+2 |
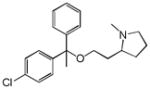 Clemastine |
|
0.31 | SLC6A4 | 1.1×10⁻¹⁴ | 0.42 | KCNH2 | 6.1e+1 |
|
Dyclonine |
|
0.36 | DRD4 | 1.5×10⁻¹⁷ | 4.1 | SLC6A3 | 2.3e+2 |
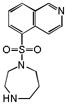 Fasudil |
|
0.37 | ADRA2A | 1.1×10⁻⁷ | 4.0 | CCR2 | 1.5e−9 |
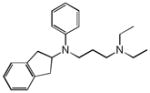
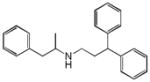 Prenylamine |
|
0.31 | OPRM1 | 1.1×10⁻⁸ | 1.8 | CACNA1G | 3.5e+0 |
|
0.30 | HRH1 | 3.2×10−66 | 7.9 | SCN5A | 3.3e−1 | |
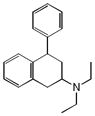
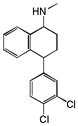 Sertraline |
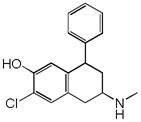
|
0.33 | HRH2 | 5.1×10−45 | 1.4 | HTR4 | 6.8e−51 |
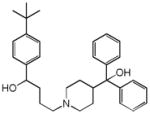 Terfenadine |
|
0.24 | SCN5A | 8.9×10⁻⁸ | 7.1 | CYP2D6 | 5.9e+1 |
a
Tc: The Tanimoto coefficient using ECFP_4-based molecular similarity to the closest ChEMBL reference molecule in the target set.
b
Closest known target: a known target of the drug that has highest sequence similarity to the predicted target.
c
BLAST E-value: based on the sequence identity of the predicted target to the closest known target; values greater than 10−5 represent unrelated proteins.