
Figure 4.
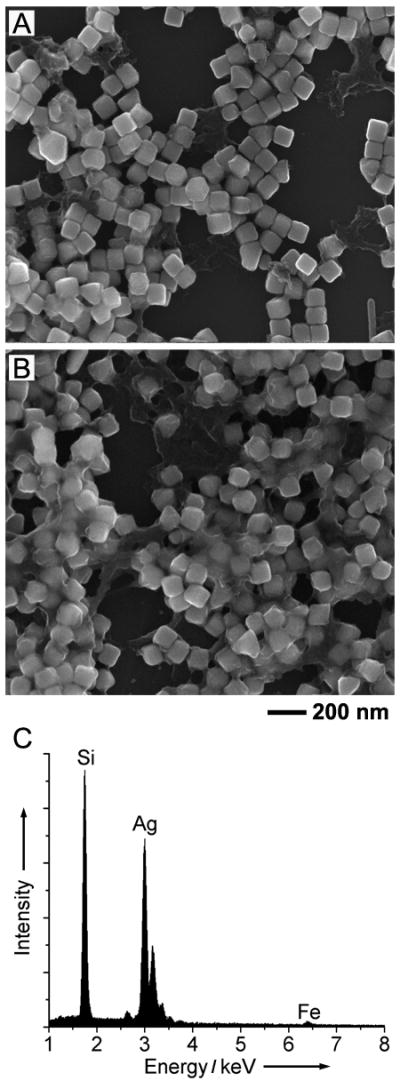
(A, B) SEM images of two samples obtained by wet etching for (A) 1 h and (B) 18 h, respectively. The etching was carried out under the same conditions as those used in Figure 2, except that no PVP was added. (C) EDX spectrum taken from the 18-h sample.