
Figure 5.
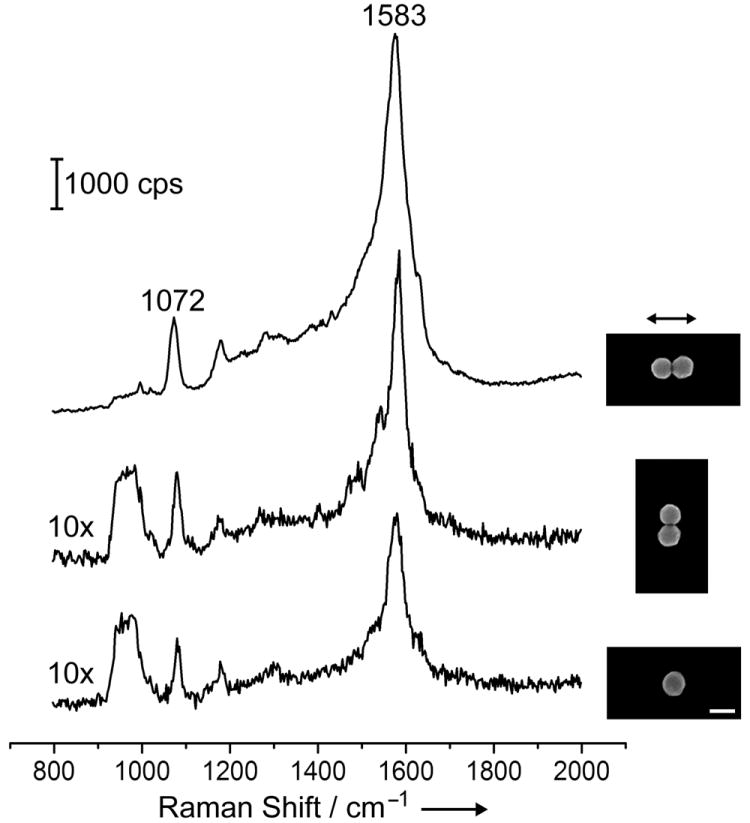
SERS spectra taken from a dimer of Ag nanospheres when the laser polarization was parallel (top trace) and perpendicular (middle trace) to the longitudinal axis of the dimer; and from a single Ag nanosphere (bottom trace). As indicated by “10x”, the intensity of the SERS signals was multiplied by ten times for the middle and bottom traces. The insets show the corresponding SEM images. The scale bar corresponds to 100 nm and is applied to all the images.