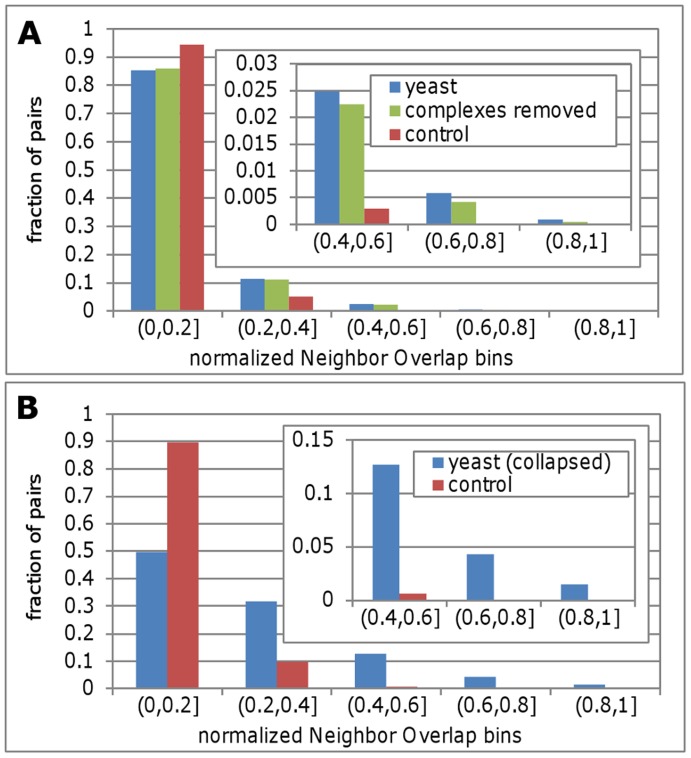
Figure 2. Enrichment of Neighbor Overlap in the yeast protein-protein interaction network – with and without complexes.
Panel A shows the distribution of Neighbor Overlap using the NOnorm measure, for yeast (blue bars) versus control (red bars). Assessing the contribution of protein complexes to Neighbor Overlap was implemented by removing protein pairs that belong to the same complex from the original analysis (green bars). Panel B shows the yeast (blue bars) and control (red bars) NOnorm distributions on a collapsed version of the yeast interaction network. This was achieved by collapsing all proteins that are part of the same complex to a unified node and computing NOnorm values for the new network. To overcome difference in scale, the higher NOnorm bins are presented in the enlarged inserts. The figure shows that complexes contribute considerably to the NO enrichment, but even when complexes are removed the NO signal is strongly evident.

