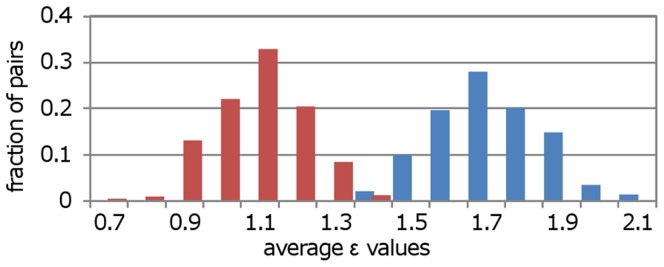
Figure 5. High Neighbor Overlap pairs have stronger genetic interactions than low ones.
The distributions represent the average ε values of 1000 subsets (each of size 100) from the high (blue bars) and low (red bars) Neighbor Overlap groups. Clearly, the ε values are higher for the high than for the low group.

